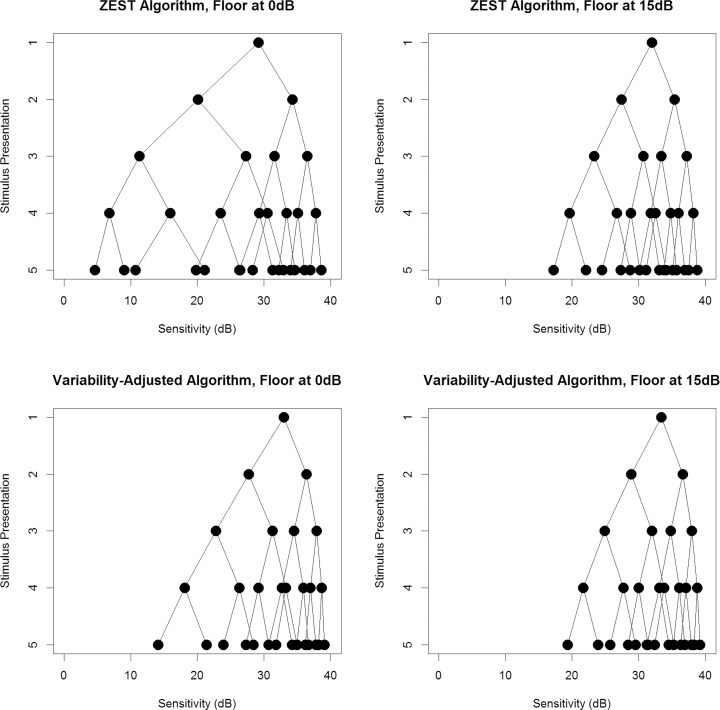
Figure 2.
The possible sequences of stimulus presentations that could occur when the initial guess of sensitivity from prior information is 35 dB. The top row shows results using the standard ZEST algorithm; the bottom row shows results using our new VAA. The left-hand plots allow sensitivities down to 0 dB, whereas the right-hand plots limit sensitivities to being 15 dB or higher.

