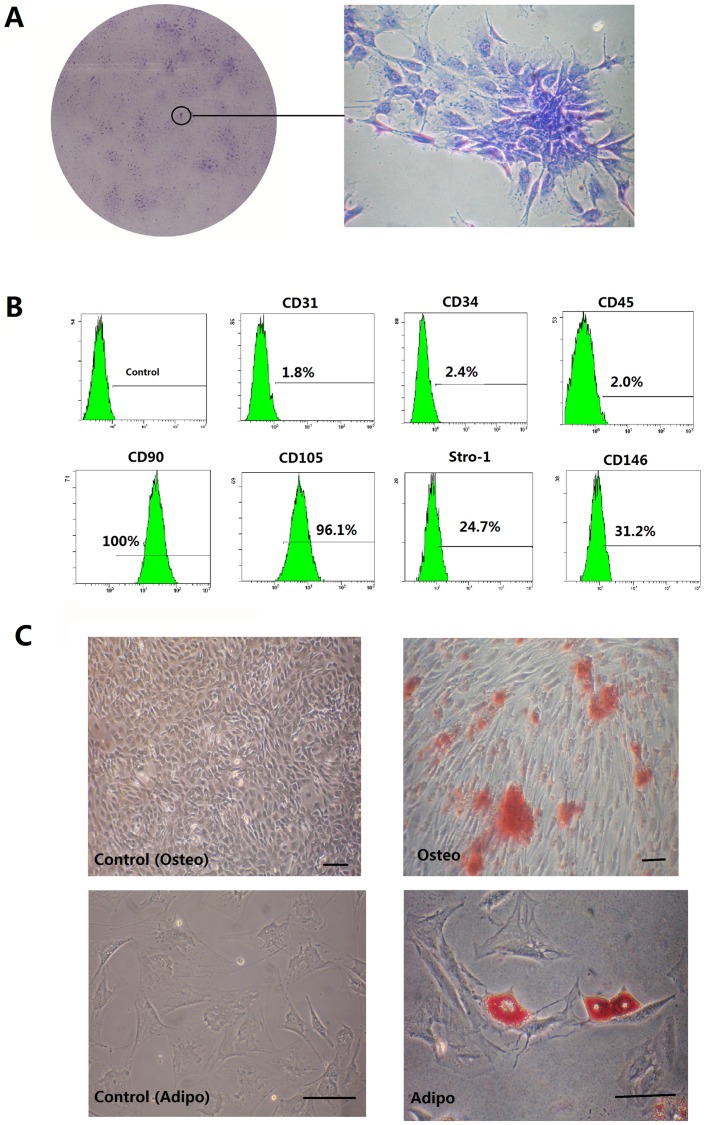
Figure 1. Isolation and identification of ADSCs.
(A) Representative images of colonies formed by ADSCs at low seeding density after 2 weeks in culture. (B). Flow cytometry analysis of the expression of cell surface markers related to mesenchymal (CD31, CD90, CD105, CD146 and STRO-1) or hematopoietic stem cells (CD34 and CD45). Cont: isotype control. (C) After ADSCs were cultured under osteogenic inductive conditions for 21 days, mineralized nodules were detected following alizarin red staining. ADSCs formed lipid clusters that stained positive for Oil Red O after 21 days of adipogenic induction. Scale bars represent 100 µm.

