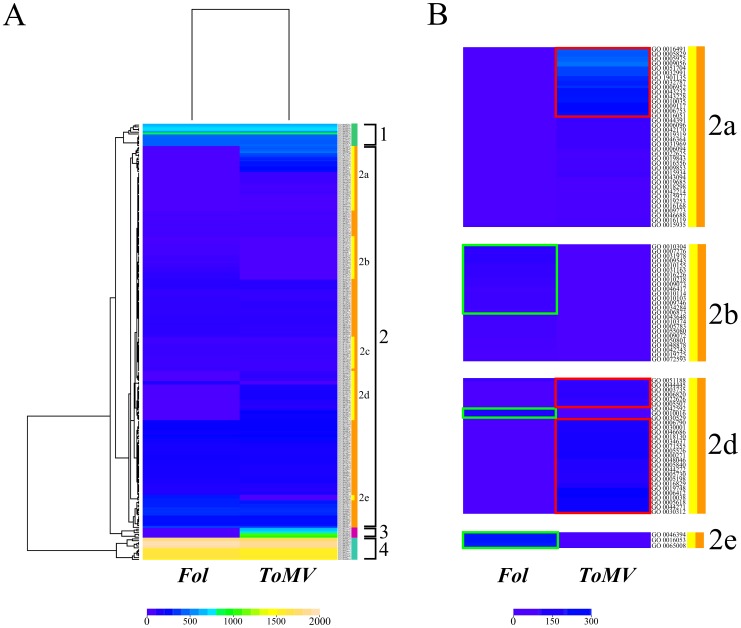
Figure 2. Heatmap of Gene Ontology enriched terms in the two interactions.
Gene Ontology terms enriched are obtained comparing a differential group (differentially regulated genes in each interaction) whit a reference group (all gene of chip) using Fisher’s Exact Test, with Multiple Testing Correction of FDR, estimated at P value of <0.05. A, The rows of heatmap represent GO-terms and the columns represent samples. Each cell is colorized based on the number of genes associated with that category GO in that particular sample. B, Subclusters composed of specific GO-terms of the tomato-pathogen interactions. The green boxes highlight specific GO terms of tomato-Fol interaction, the red boxes specific GO terms of tomato-ToMV interaction.

