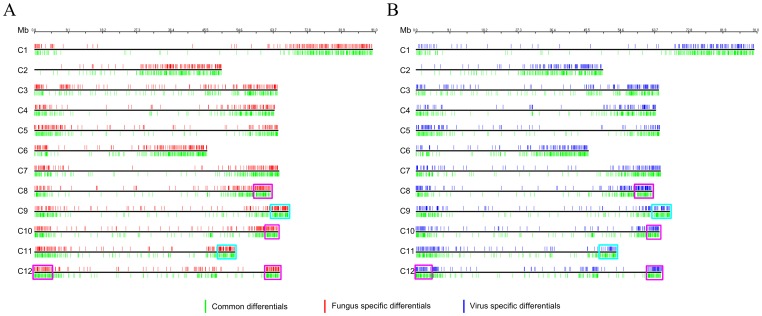
Figure 4. Physical genome locations of tomato (Solanum lycopersicum) differentially regulated genes.
A, Physical map of the tomato-Fol interaction. B, Physical map of the tomato-ToMV interaction. Tomato chromosomes are represented as black horizontal bars, the approximate location of each gene is designated with vertical lines on chromosomes. The color used for each gene indicates specificity (red: differentially regulated genes in tomato-fungus interaction, blue: differentially regulated genes in tomato-virus interaction, green: overlapping differentially regulated genes. The cyan boxes on chromosomes 9 and 11 indicates the chromosomal regions in the vicinity of the Tm2(2) and I2 genes. The violet boxes on chromosomes 8, 10 and 12 indicates the richest regions of genes.

