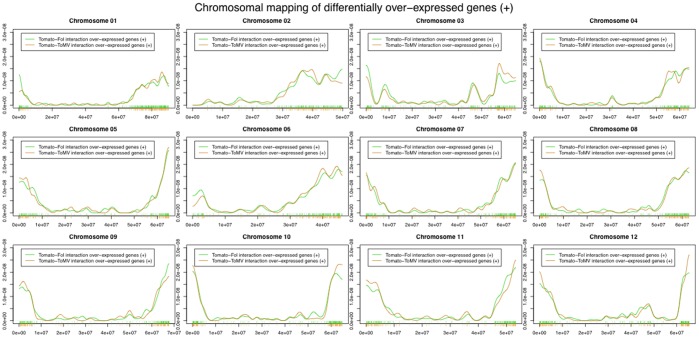
Figure 6. Distribution of chromosome location of over-expressed genes.
The x-axis in each panel represents the range of the corresponding chromosome. The location of each differentially regulated genes in each chromosome is represented as a vertical lines at the midpoint of the location of the corresponding base pairs. The distribution of the location of all the coding genes spotted on the microarray is used as a reference and is drawn in red. The orange line represents the distribution of under-expressed genes in tomato-ToMV interaction. The green line represents the distribution of under-expressed genes in tomato-Fol interaction.

