
Figure 2. Food intake and body weight distribution and normalized body weights of mice on different food restriction amounts.
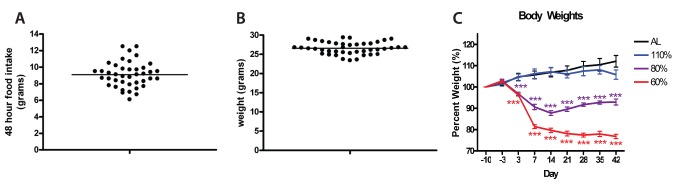
(A) Individual measurements of food intake over a 48 hour period for individual mice divided by 2 to give a 24 hour food intake (n = 42). (B) Individual measurements of body weight prior to any dietary change (day−10) (n = 42). (C) Mean body weight measurements +/− SEM of each treatment group over the duration of the experiment. Mice fed AL (black; n = 8), 110% (blue, n = 8), 80% (purple; n = 8) and 60% (red; n = 10) show dose-dependent changes in body weight depending on food availability. Significance was tested with Tukey-Kramer multiple comparisons test with one-way ANOVA post-test for all treatment groups vs. AL controls for each respective day. ***denotes p<0.001.