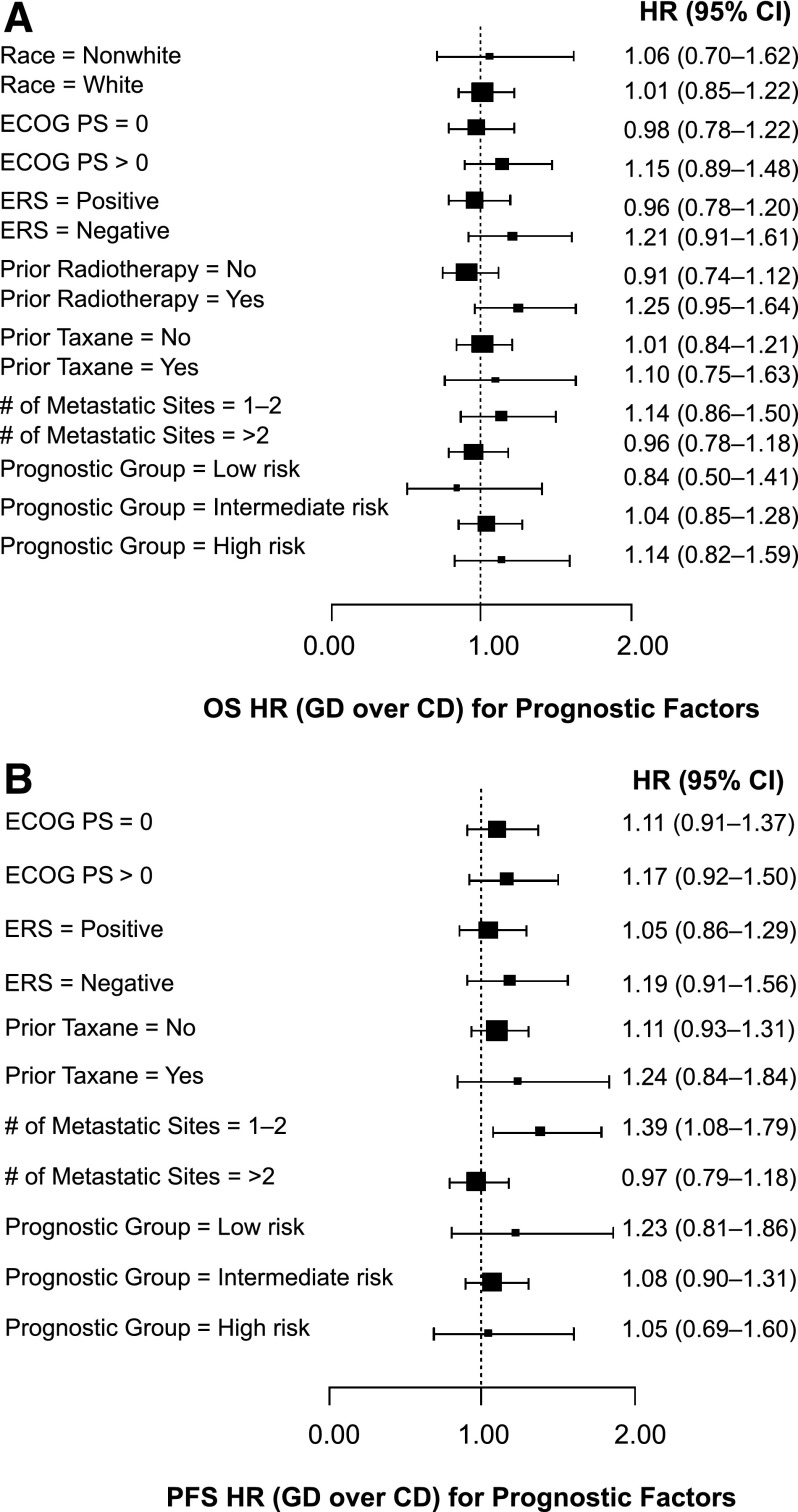
Figure 4.
Forest plots. Subgroups were identified using a multivariate Cox model. Squares indicate point estimates; horizontal lines indicate 95% CIs. (A): Overall survival. (B): Progression-free survival. HR >1 favors CD; HR <1 favors GD. For PFS, Wald p = .026 for treatment arm and number of metastatic sites.
Abbreviations: CD, capecitabine-docetaxel; CI, confidence interval; ECOG PS, Eastern Cooperative Oncology Group performance status; ERS, estrogen receptor status; GD, gemcitabine-docetaxel; HR, hazard ratio; OS, overall survival; PFS, progression-free survival.

