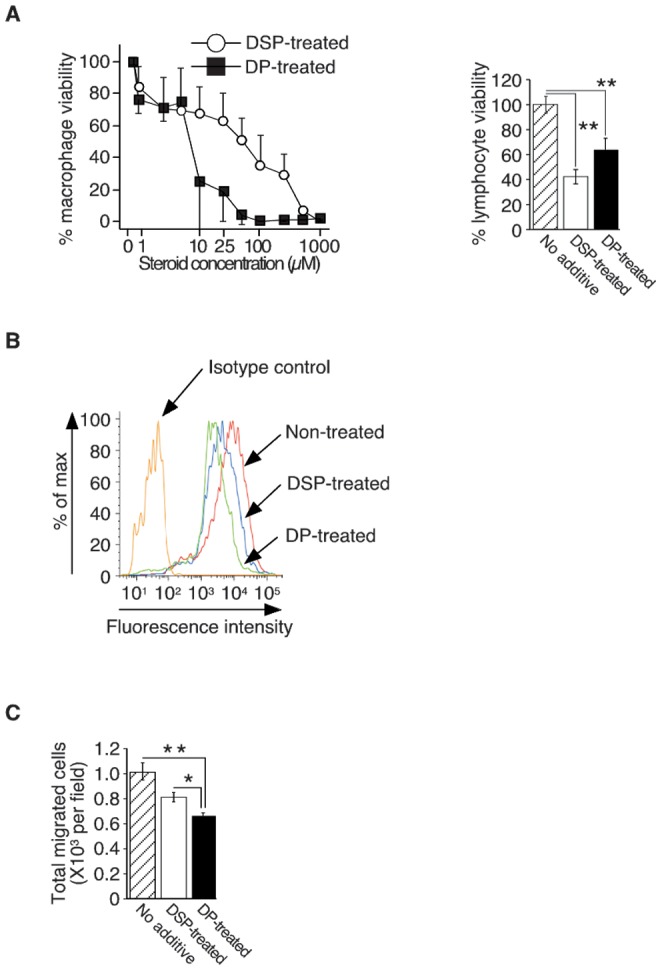
Figure 2. Effect of dexamethasone palmitate on macrophages in vitro.

A: The viability of mouse macrophage-like RAW264.7 cells after dexamethasone sodium phosphate (DSP) or dexamethasone palmitate (DP) treatment (48 hours) was evaluated by using a colorimetric assay (left panel). The percentage viability was calculated as follows: (O.D value in the presence of each concentration of steroid/O.D value without steroid) ×100. The results reflect the mean ± SD of three independent determinations (representative experiment of three performed). The viability of splenic T lymphocytes after exposure to DSP or DP (25 nM each, 48 hours) was assessed by trypan blue exclusion (right panel). Viable cells were determined as Trypan blue- negative cells. The percent viability was calculated as follows: (viability in DSP or DP group/viability in control group) ×100 (%). The results reflect the mean ± SD of three independent determinations (representative experiment of three performed). B: CCR2 expression on the surface of mouse primary peritoneal macrophages after DSP or DP treatment was evaluated by FACS. The results are representative of three independent experiments (left panel). C: The migration of peritoneal macrophages towards CCL2 after DSP or DP treatment was analyzed using transwell assays. For quantitative analysis, four fields were randomly selected, and migrated cells were counted under a light microscope (×200). The results reflect the mean ± SD of four independent determinations. Representative results of three independent experiments are shown (right panel). Statistical significance: *P<0.05 and **P<0.01.
