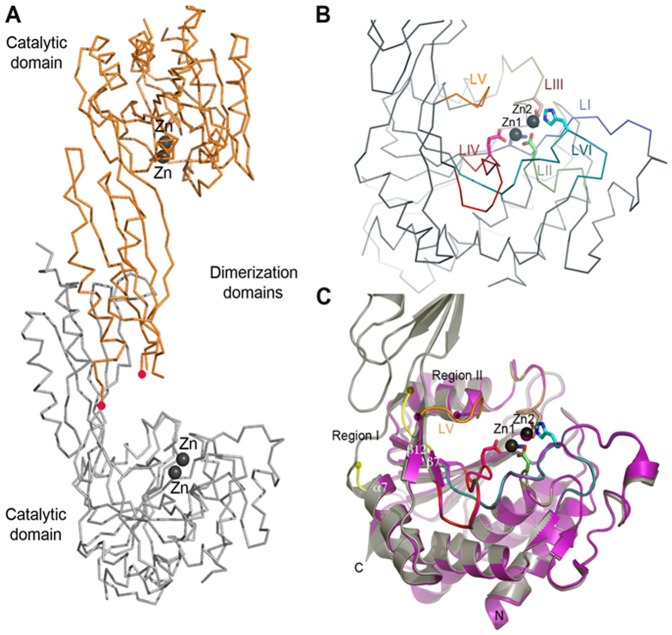
Figure 1. X-ray Crystal Structures of WT-HiDapE and HiDapET.
A) Dimer architecture based on the structure of WT-HiDapE. B) Close-up view of the catalytic domain of WT-HiDapE. Ribbon diagram showing the active site formed by six loops (LI–LVI); five of them coordinate the Zn ions (LI–IV & VI). C) Superimposition of the structure of WT-HiDapE (black) over HiDapET (magenta). Active site Zn(II) ions are shown as black and magenta spheres for WT-HiDapE and HiDapET, respectively. Regions where differences are most prominent are labeled Region I (yellow) and Region II (orange). Yellow and magenta circles highlight two disordered loop regions in the HiDapET structure. The red dots marked disordered loop that contains conserved His residue.

