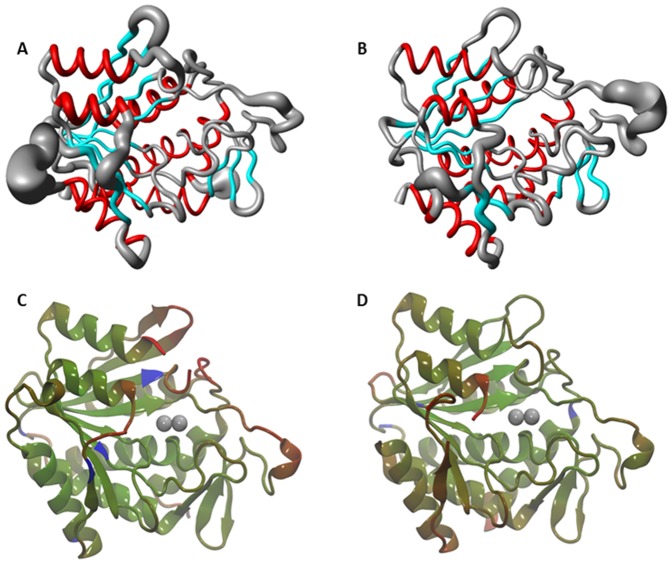
Figure 3. Diagrams Showing Regions of Flexibility in Truncated DapE Proteins.
A) MOLMOL diagram of [ZnZn(VcDapET)] molecular dynamics. B) MOLMOL diagram of [ZnZn(HiDapET)] molecular dynamics (the thickness of the line is proportional to the variation of the protein structure during the simulation). The crystallographic temperature factors indicating that the most dynamic (in red) and the most rigid (in blue) parts of the protein: C) [ZnZn(VcDapET)]. D) [ZnZn(HiDapET)].

