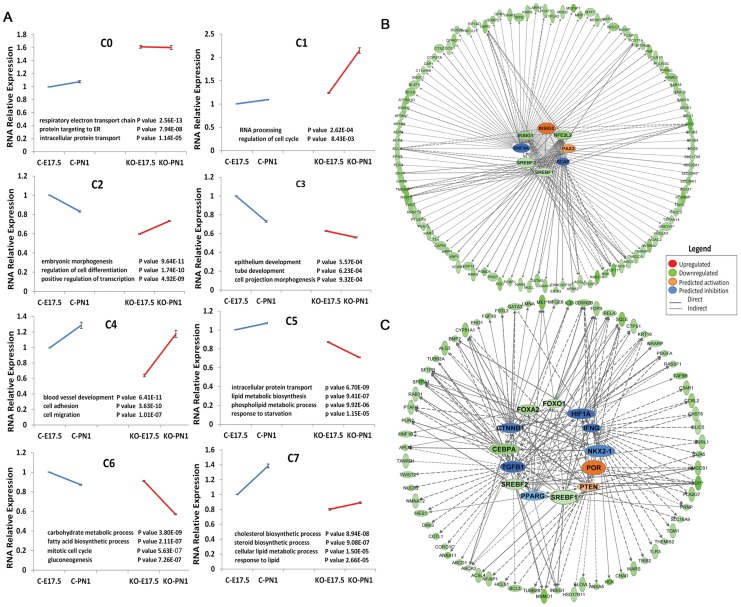
Figure 4. SREBP transcriptional network regulates lipogenic pathways.
A) Clustering analysis of genes differentially expressed in ScapΔ/Δ mice vs. control at E17.5 and PN1 using a Self-organizing map. Genes from Clusters 5 and 7 were functionally enriched in lipid biosynthesis and metabolism. B) Upstream network analysis of Cluster 5 genes. Genes down-regulated in response to Scap deletion are shown as green nodes, genes that were unchanged but predicted to be involved in the process are shown in orange (activation) and blue (inhibition) respectively. C) Upstream network analysis of Cluster 7 genes. In addition to Srebf1/2, Cebpa, Foxa2 and Foxo1 were decreased in response to Scap deletion (shown as green nodes). Genes that were unaltered but predicted to be involved in the regulation of Cluster 7 genes, including Por and Pten (orange nodes indicate activation), Tgfb1, Nkx2-1, Ifng, Pparg, Ctnnb1 and Hif1a (blue indicates inhibition), are shown.

