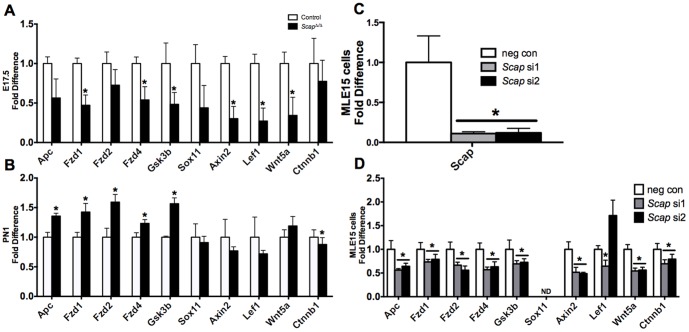
Figure 7. Scap modulates expression of Wnt pathway components.
A and B) qPCR analysis demonstrates altered expression of Wnt signaling genes in ScapΔ/Δ E17.5 (A) and PN1 (B) whole lung tissue compared to littermate controls. Results were normalized to 18 s RNA, n = 3–4/group, *p<0.05 vs. control at the respective time point. C and D) qPCR analysis demonstrates decreased expression of Scap (C) and of Wnt pathway (D) genes in MLE15 cells following transfection with negative control (neg con) and two distinct Scap siRNAs (si1 and si2). Results were normalized to 18 s, n = 6 samples/group representing 3 independent experiments, *p<0.05 vs negative control. ND = non-detectable.

