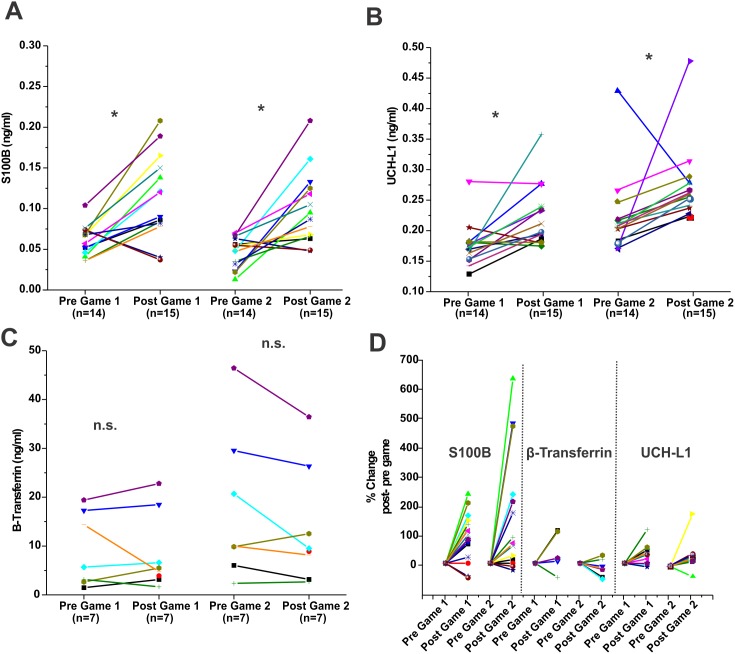
Figure 1. Pattern of S100B, UCH-L1 and β-2 transferrin changes in players after football games.
Serum samples were drawn as described in the Methods. A total of 15 players were enrolled and analysis of samples reported here refers to two games played during the regular season. A), B) and C) refer to absolute S100B, UCH-L1 and β-2 transferrin serum levels respectively. Serum levels were measured pre- (day before the game) and post-games (within one hour from the end of a game). In D) the normalized S100B, UCH-L1 and β-2 transferrin serum levels are shown side by side to allow a direct comparison. Normalized values for a given serum markers were obtained by the following equation:  . In the figures, each symbol represents a player and any given player is represented by the same symbol throughout this manuscript. Note that on average S100B and UCH-L1 were increased after a game, while the values for beta-2 transferrin remained unchanged. Also note that the beta-2 transferrin values pre-game were highly variable (C) while most of baseline values for S100B and UCH-L1 fell within a defined range. Statistical differences by student's t-test are shown as (*) for p<0.05; and n.s. for not significant.

