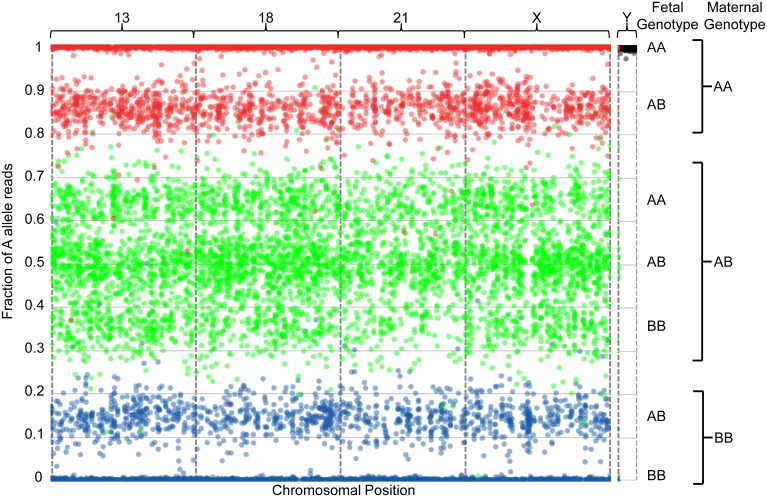
Figure 2. Graphical representation of sequencing data from one euploid sample with a 28.1% fetal fraction.
SNPs are assumed to be binary (the algorithm ignores other minor alleles) and are indicated as A and B for simplicity. For each plot, the number of A allele reads is plotted as a fraction of the total allele reads (y-axis) against the linear position of each of several thousand interrogated SNPs on the chromosomes-of-interest (x-axis). The x-axis represents the linear position of each SNP along the indicated chromosome. Interrogated chromosomes are indicated above the plot. Each spot represents a single SNP, where the precise position along the y-axis represents the additive contribution of maternal and fetal cfDNA to the fraction of A allele reads and is thus a function of the sum of fetal and maternal allele reads for that locus as well as of fetal fraction. The contribution of reads from fetal alleles results in distribution of the spots into distinct clusters that can be used to infer chromosomal copy number. Fetal and maternal genotypes at individual SNPs are indicated to the right of the plots. To more easily visualize the maternal and fetal contributions, spots are color-coded according to maternal genotype: SNPs for which the mother is homozygous for the A allele (AA) are indicated in red, those for which the mother is homozygous for the B allele (BB) are indicated in blue, and those for which the mother is heterozygous (AB) are indicated in green. All clusters that are not tightly associated with the limits of the plots are useful for inferring ploidy, as described in the Results section.

