
Figure 2. Gene and Protein Expression for Bcll11b.
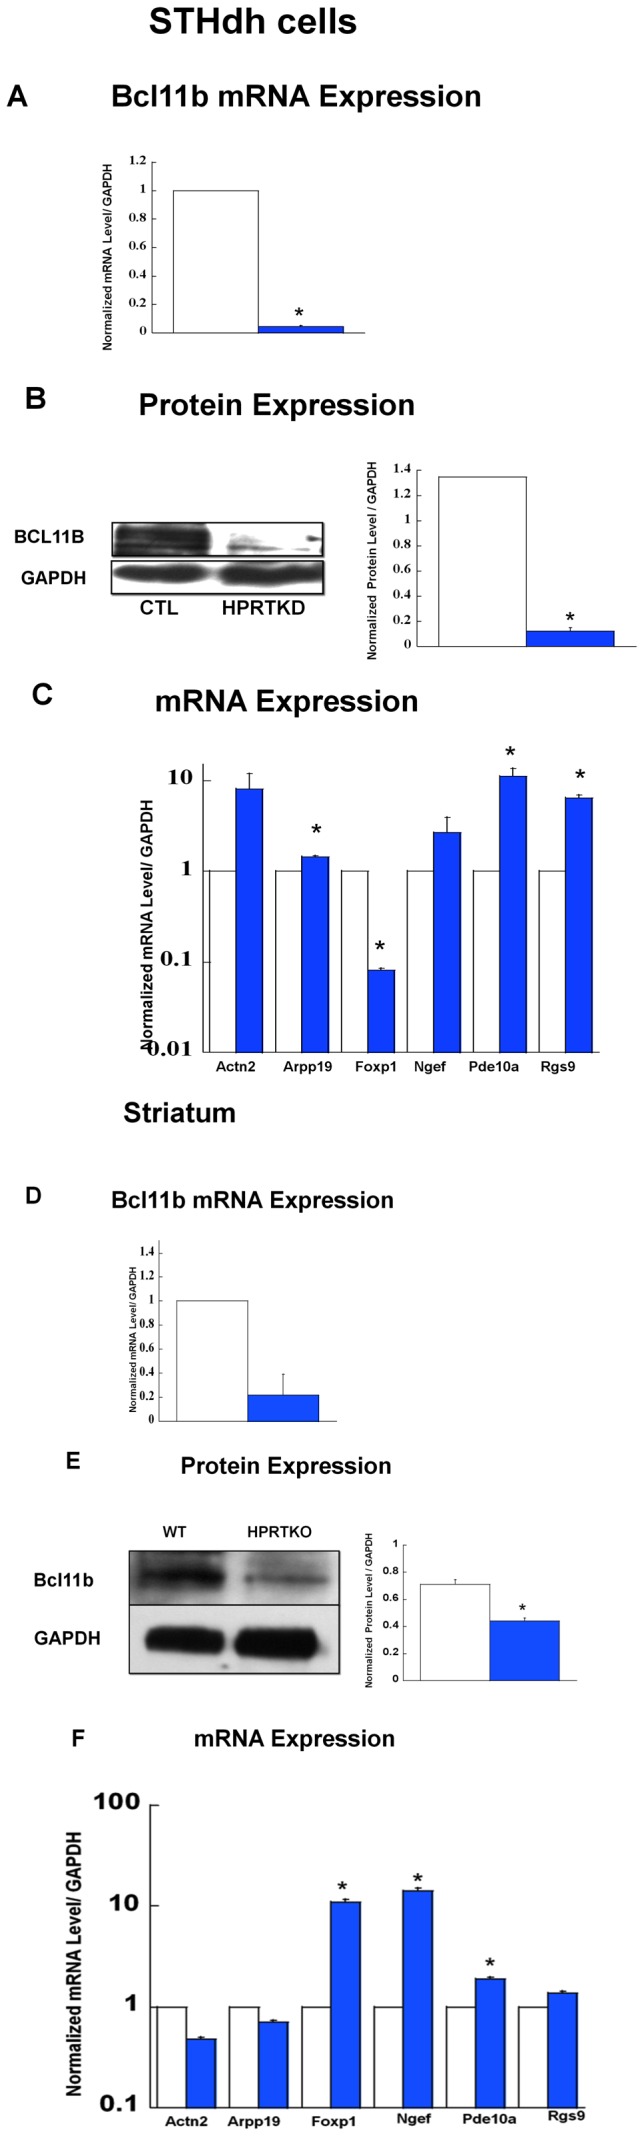
(A) Gene expression for Bcl11b in control striatal STHdh cells (CTL, open bars) and HPRT-knockdown (HPRTKD, closed bars). Bars represent mean ±SEM (n = 4). mRNA expression is normalized to GAPDH RNA level (*P<0.05, t-test). (B) Immuno-blot and quantification of Bcl11b protein expression in striatal cells. The quantification bar graphs are shown as means ± SEM (n = 3, *P<0.05, t-test). (C) Gene expression of Actn2, Arpp19, Foxp1, Ngef, Pde10a, and Rgs9 in control (CTL, open bars) and HPRT knockdown (HPRTKD, closed bars) striatal STHdh cells. Bars represent mean ±SEM (n = 4). *P<0.05, t-test. (D) Gene expression for Bcl11b in the striatum of wild-type (WT, open bars) and HPRT knockout (HPRTKO, closed bars) mice. Bars represent mean ±SEM (n = 4). mRNA expression is normalized to GAPDH RNA level (*P<0.05, t-test). (E) Immuno-blot and quantification of Bcl11b protein expression in the striatum of WT and HPRTKO mice. The quantification bar graphs are shown as means ± SEM (n = 3, *P<0.05, t-test). (F) Gene expression for Actn2, Arpp19, Foxp1, Ngef, Pde10a, and Rgs9 in control (Wild-type, open bars) and HPRT knockout mice (HPRTKO, closed bars) striatum. Bars represent mean ±SEM (n = 4). *P<0.05, t-test.