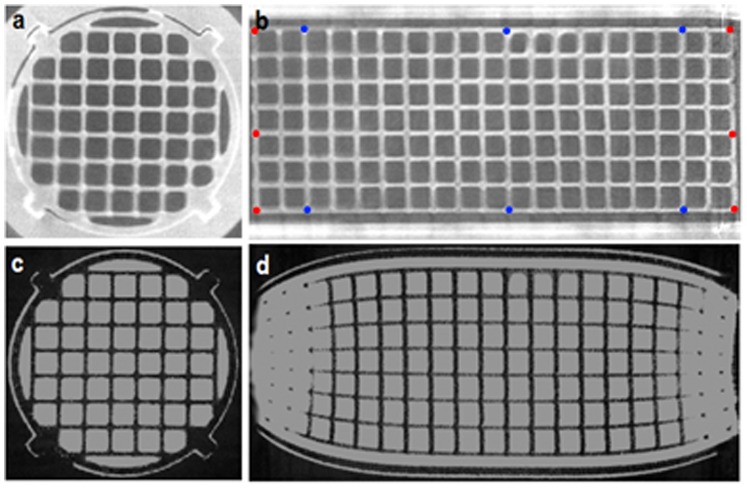
Figure 3. CT and MRI images of phantom.
Axial (a) and coronal (b) slices from CT data and corresponding axial (c) and coronal (d) slices from 3D gradient echo MRI data. Landmarks for distance measurements are shown (b) for Z axis (red) and Y axis (blue) (landmarks in X axis are orthogonal to those in the Y axis at same Z coordinates).

