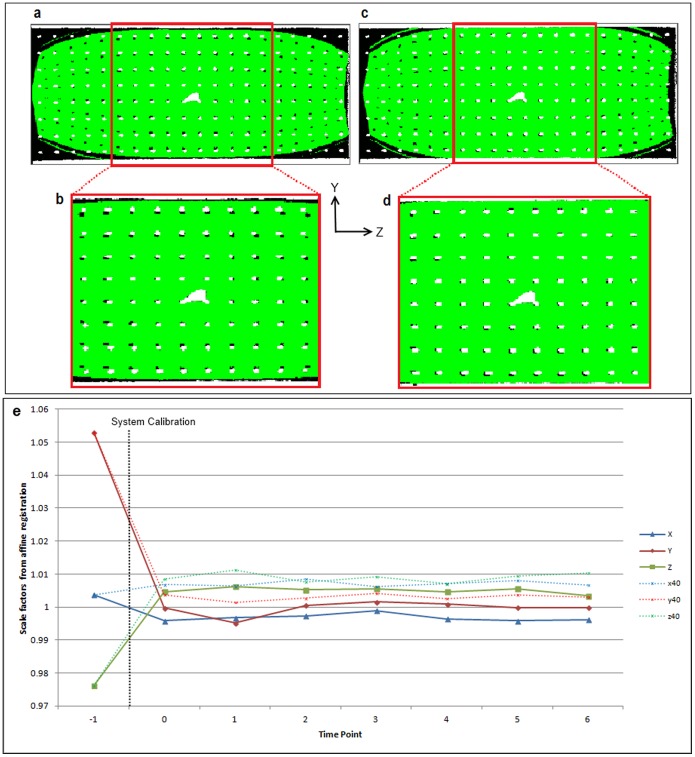
Figure 4. Gradient scaling values before and after system calibration.
Sagittal slices of CT phantom images (white) overlaid on MRI images (filler inside phantom shown in green, phantom structure shown in black, 26×60 mm FOV ) showing alignment before (a, b) and after (c, d) system calibration. The errors in the scaling factors (e) prior to calibration (time point −1) are reduced after system adjustment (TP 0) and the factors calculated using 100 µm data (X, Y, Z) are in good agreement with the 40 µm data (x40, y40, z40).

