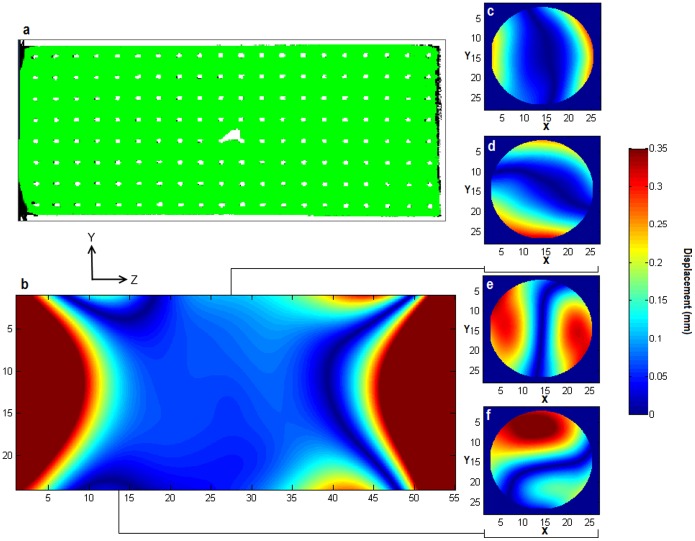
Figure 5. Displacement fields generated from post-processing correction.
Projection along the X axis from CT phantom data (white) overlaid on MRI images (filler inside phantom shown in green, phantom structure shown in black) show good alignment after post-processing correction (a). Displacement fields generated from the non-rigid registration show displacements increase along the Z axis (b) as distance from the centre increases. This is also observed in the X (c) and Y (d) axes for central slices. Slices taken further from the centre show the displacements in the X (e) and Y (f) directions increase more rapidly with distance from the slice centre.

