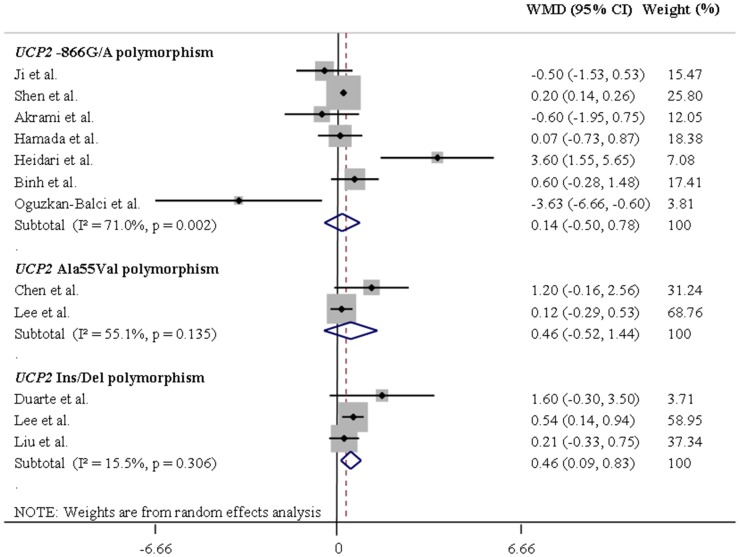
Figure 5. Forest plots showing individual and pooled weighted mean differences (95% CI) for the associations between UCP2-866G/A, Ala55Val and Ins/Del polymorphisms and body mass index in Asians, under a dominant inheritance model (G/G vs. A/A + G/A for the UCP2-866G/A polymorphism, Ala/Ala vs. Val/Val + Ala/Val for the UCP2 Ala55Val polymorphism, and Del/Del vs. Ins/Ins + Ins/Del for the UCP2 Ins/Del polymorphism).
The area of the squares reflects the study-specific weight. The diamond shows the summary random-effect weighted mean differences estimated from the studies.

