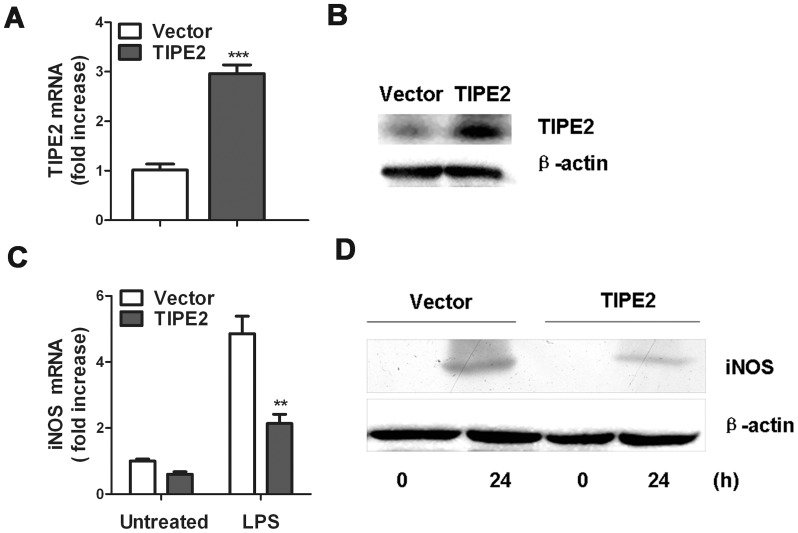
Figure 1. Effect of TIPE2 Overexpression on LPS-induced iNOS expression.
RAW264.7 cells were stably transfected with TIPE2 plasmid or vector control. TIPE2 expression levels were determined by quantitative RT-PCR (A) and Western blot (B), respectively. For quantitative PCR, the results were presented as folds expression of TIPE2 RNA to that of β-actin. TIPE2 overexpression RAW264.7 cells or control cells were treated with 100 ng/mL LPS for 24 h, and iNOS mRNA (C) and protein (D) levels were detected by quantitative PCR and Western blot, respectively. Data are shown as mean ±SE of one representative experiment. **P<0.01; ***P<0.001.

