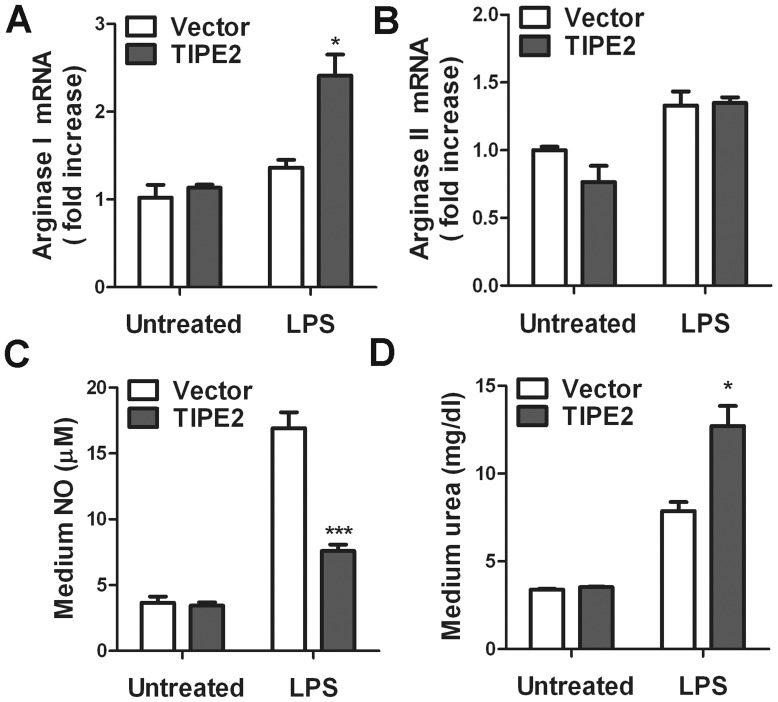
Figure 2. Effect of TIPE2 overexpression on LPS-induced arginases mRNA expression, NO and urea production in macrophages.
A and B, RAW264.7 cells overexpressing TIPE2 or control cells were treated with 100/mL LPS for 4 h, and expression levels of arginaseI and arginase II mRNA were determined by quantitative PCR. Culture media were collected for NO and urea measurement (C and D). Data are shown as means ±SE of triplicates from an experiment that was repeated a total of three times with similar results. *P<0.05.

