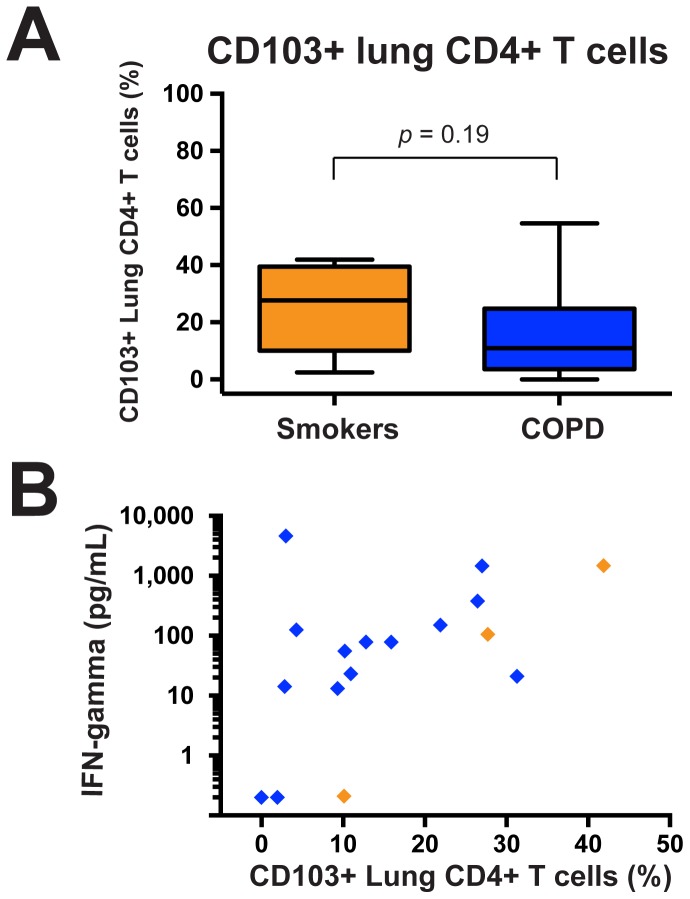
Figure 3. Production of IFN-γ protein by stimulated lung CD4+ T cells correlates with CD103+ expression.
Isolated lung CD4+ T cells were stimulated with plate-bound anti-CD3ε for 48 hours. Supernatants were collected and Luminex assays were used to measure IFN-γ. A. Aggregated percentages of CD103+ cells among lung CD4+ T cells of smokers with normal spirometry (maize; n = 7) and COPD subjects (blue; n = 17). The Mann Whitney t-test was used to determine significant differences between groups. B. Correlation between stimulated IFN-γ protein concentrations (vertical axis, log scale) and percentage of CD103+ lung CD4+ T cells (horizontal axis). Smokers with normal spirometry (orange diamond; n = 3) and COPD subjects (blue diamonds; n = 14) are a subset of those in panel A, as not all subjects had corresponding protein data. Statistics by Spearman correlation.

