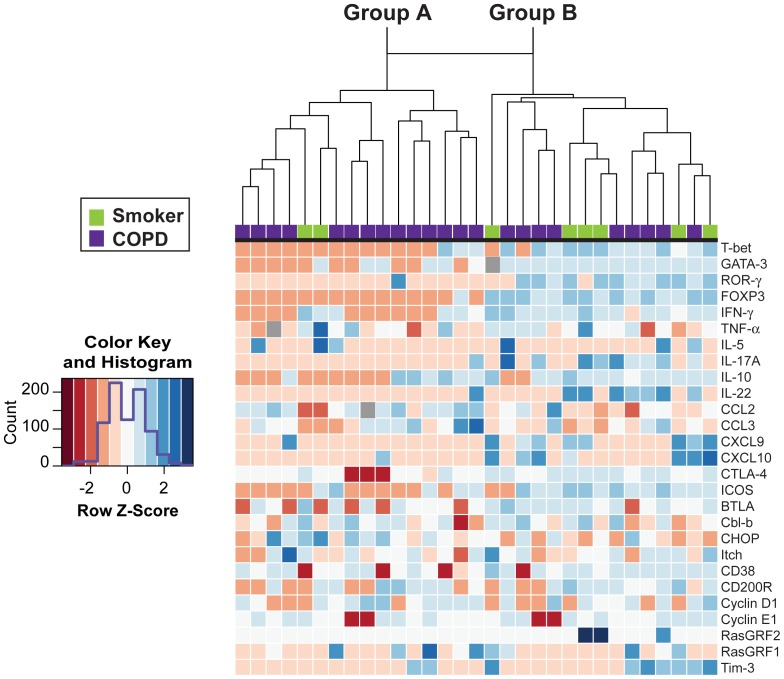
Figure 4. Unsupervised hierarchical clustering separates subjects based on unstimulated lung CD4+ T cell gene expression profiles.
Transcripts for 27 genes were measured by real-time RT-PCR from isolated lung CD4+ T cells and results were displayed as a heat map. Columns represent individual subjects; gene identities are shown on the right. Red = down-regulated, white = unchanged, blue = up-regulated, grey = missing data. Based on spirometry plus clinical diagnosis, subjects were classified (top) either as smokers without COPD (green; n = 8) or COPD (purple; n = 23). Unsupervised hierarchical clustering divided the subjects into two distinct groups, as indicated by the dendrogram. Group A contained 14 of 23 COPD subjects and two of eight smokers without COPD, while Group B consisted of the remaining six smokers without COPD and the other nine COPD subjects. The Row Z scores were calculated from log-transformed arbitrary units.

