
Figure 8. Group A subjects have expansion of an unusual population (CD62L−, CD27+), but not of TEM.
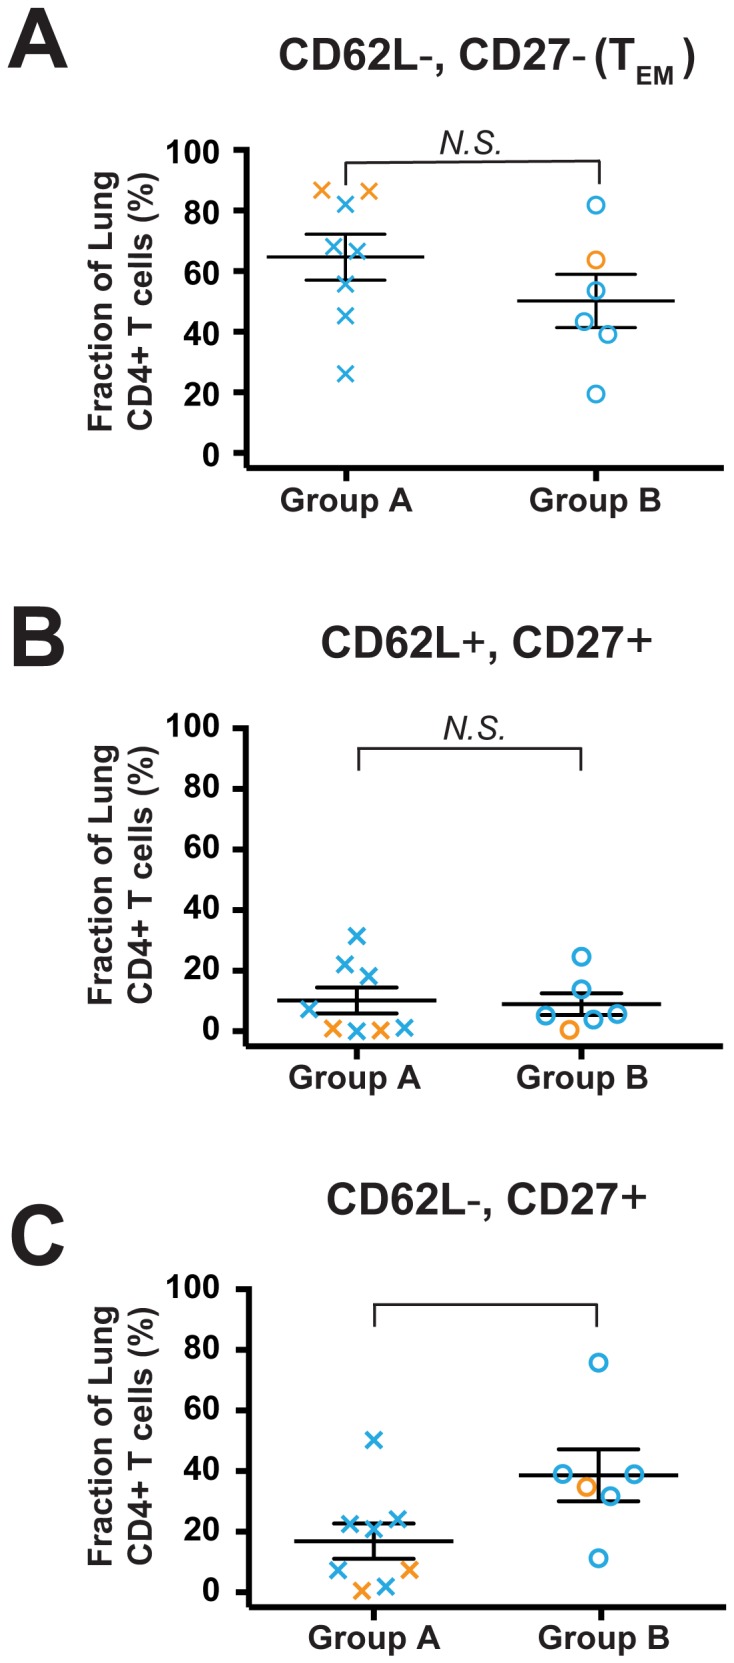
Available flow cytometry data on subjects in Group A and Group B were analyzed to determine the fraction of lung CD4+ T cells in each of the quadrants defined by CD62L and CD27 expression. (A) CD62L− CD27− TEM; (B) CD62L+ CD27+; (C) CD62L− CD27+. Symbols represent individual patients, lines represent the mean ± SEM. Group A subjects (Xs; n = 8) and Group B subjects (circles; n = 6); orange symbols represent smokers without COPD (n = 3) and blue symbols represent subjects with COPD (n = 10). The Mann Whitney t-test was used to determine significant differences between groups. N.S., not significant.