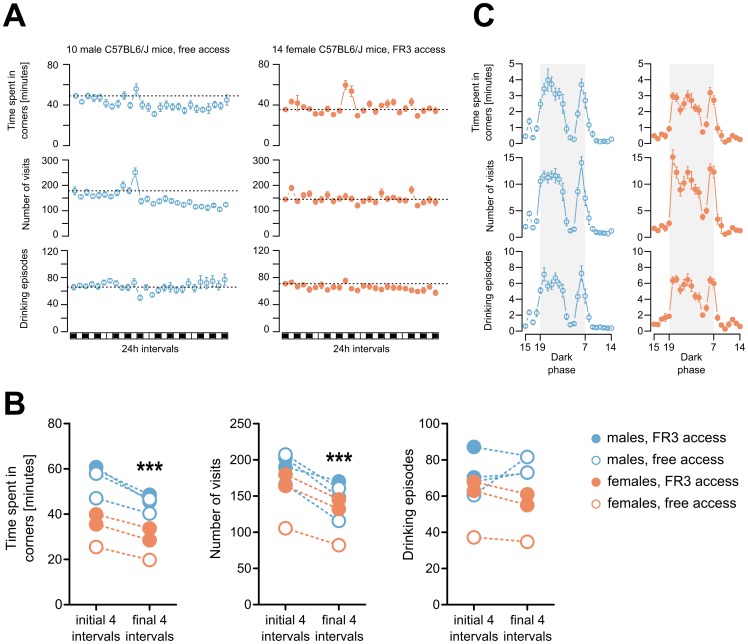
Figure 2. Corner activity during the experiment.
(A) Activity in the cage corners during the experiment. The graphs illustrate the mean daily time spent in the corners and the numbers of visits and drinking episodes. Two series of data are shown; the first is for a cohort of 10 male mice with free access to bottles, and the second is for a cohort of 14 females with FR3 instrumental access. Each of the boxes on the bar below corresponds to a 24-h period, and the black boxes correspond to periods of access to alcohol. The dashed horizontal lines correspond to the value on the first day. (B) Circadian activities of the animal groups shown in A. The graphs illustrate the mean patterns of daily activity of the mice averaged across four intervals (7th, 14th, 21st and 28th). Each point represents the sum from the preceding hour. The dark period is shaded grey. (C) Summary of the corner activity data. The graphs illustrate the mean daily activities averaged across the first and last 4 days of the experiment. The dashed lines connect the points that correspond to the same cohort. The error bars in panels A and B represent the SEM. The significance of the differences in behavior during the final 4 days compared to the initial 4 days in panel C was calculated using a paired t-test (P<0.001 ***). The data are summarized from all experiments, which included 4 cohorts of 10 male mice, 2 cohorts of 14 female mice and 1 cohort of 10 female mice.

