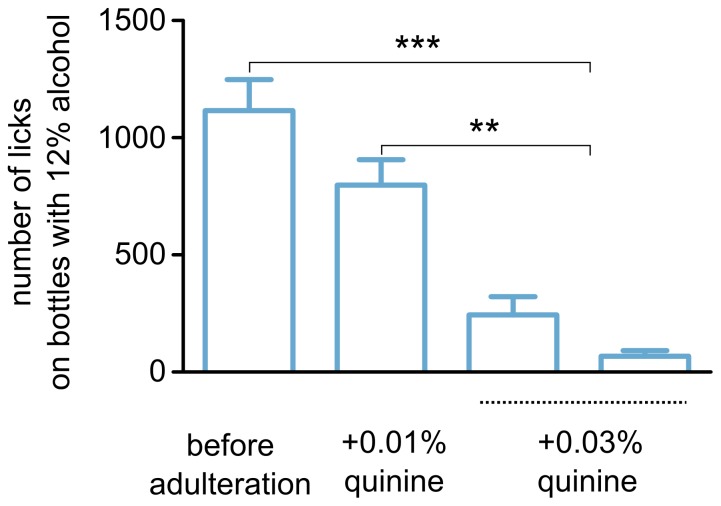
Figure 5. Effects of adulteration with quinine.
The bar graphs show the mean numbers of licks on the bottles with 12% alcohol adulterated with increasing concentrations of quinine of a cohort of 10 male mice (see Table S1 for a summary of the experiment). Each bar corresponds to a single 24-h interval, and only intervals with access to alcohol are shown. Analysis of variance indicated that the means were significantly different (F3,56 = 26.54, p<0.001; Tukey's HSD post hoc P<0.01 ** and P<0.001 ***). There was no significant difference between mean numbers of licks on the alcohol bottles before adulteration and after adulteration with 0.01% quinine.

