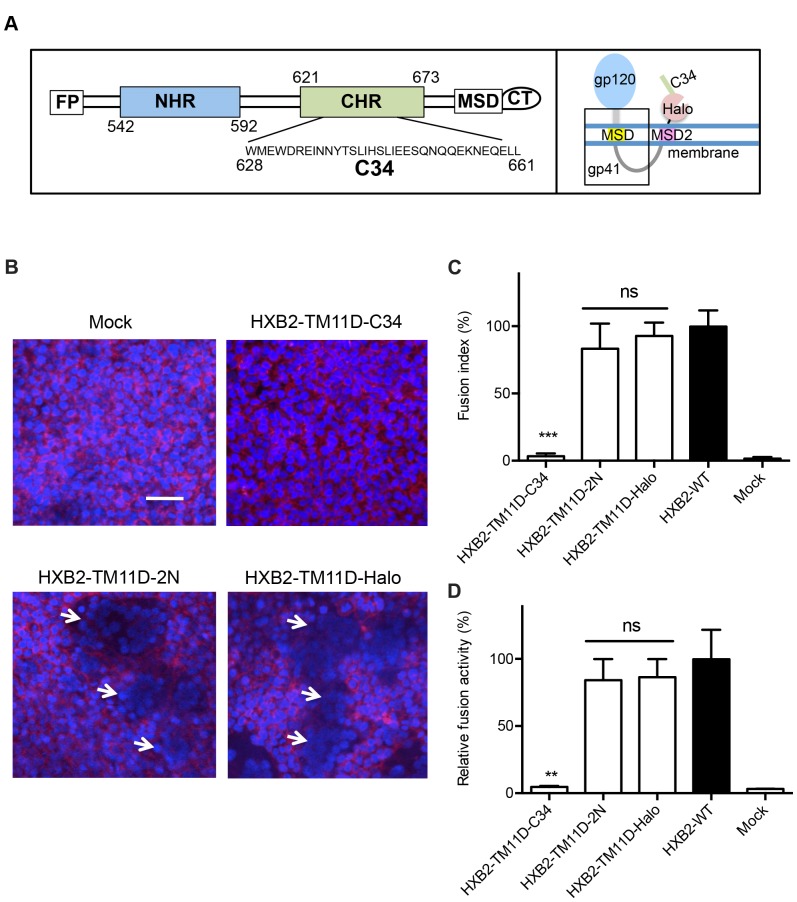
Figure 3. Measurement of fusion inhibition of tethered C34 evaluated by syncytia formation and DSP assay.
(A) Left panel: Schematic view of HIV-1 gp41. FP, fusion peptide; NHR, N-terminal heptad repeat region; CHR, C-terminal heptad repeat region; MSD, membrane-spanning domain; CT, cytoplasmic tail. The residues are numbered according to their position in HXB2 gp160. The amino acid sequence of C34 is shown. Right panel: The expected membrane topology of HXB2-TM11D-C34 is depicted schematically. (B) Syncytia formation assay in transfected 293CD4 cells. 293CD4 cells were transfected with the indicated constructs (HXB2-TM11D-Halo, HXB2-TM11D-2N, and HXB2-TM11D-C34). After 16 h, the nuclei of cells were stained with Hoechst, and the membrane was stained with CellMask Deep Red plasma membrane stain. White arrows indicate typical syncytia formed in transfected 293CD4 cells. Scale bar = 50 µm. (C) Relative fusion activity was quantified using a fusion index (see Materials and Methods). Fusion activities for each plasmid are shown after normalization to that of the non-tethered Env expression construct (HXB2-WT). The activity of HXB2-WT was set at 100%. Error bars represent standard deviations of the results of five fields. Student’s t-test was used to determine the statistical significance of the measured variables for each construct (open column) and control (solid column). Statistical significance was indicated when p<0.001 (***). ns = nonsignificant. (D) Fusion activity measured by DSP assay. Relative fusion activity was measured by DSP assay. DSP activities for each construct were compared with that of the non-tethered Env expression construct (HXB2-WT was set at 100%). Error bars represent standard deviations of the results of triplicate experiments. Student’s t-test was used to determine the statistical significance of the measured variables for each construct (open column) and control (solid column). Statistical significance was indicated when p<0.01 (**). ns = nonsignificant.

