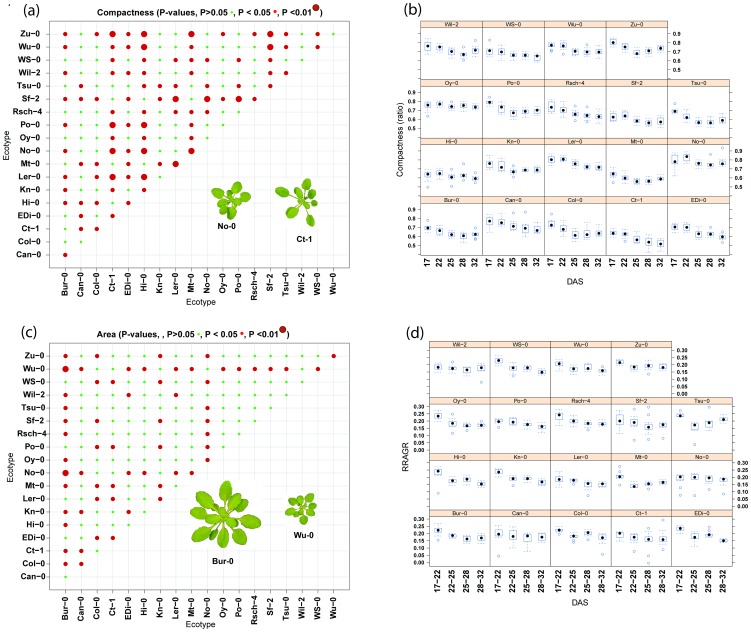
Figure 4. Multiple comparisons of Compactness and Area between ecotypes.
Scatter plots showing significant (P>0.05•, P<0.05 •, P<0.01•, Post-hoc Tukey test between ecotypes) differences between ecotypes for (A) ‘Compactness’ and (C) ‘Area’ and boxplots for (B) ‘Compactness’ and (D) Area over time. Images have been added to (A) and (B) to show range of ‘Compactness’ and ‘Area’.

