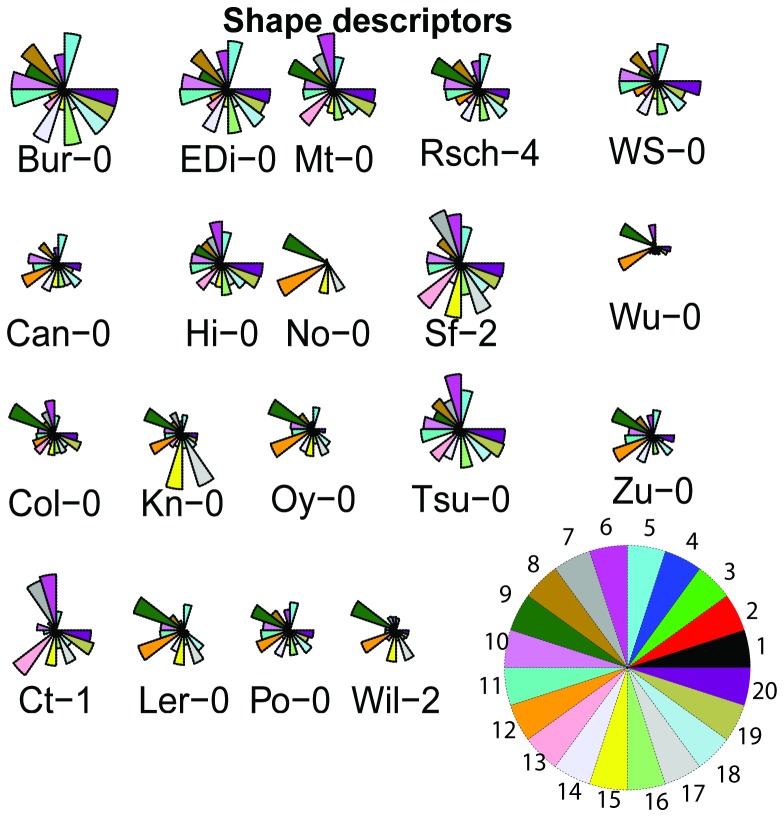
Figure 5. Shape descriptor plots of ecotype's feature profile.
Radar plot of 20 shape features for each ecotype. Plots are average of 12 replicates over five time points. Variable assignment key for star plot is located at the bottom right corner. Each star plot or segment diagram represents one row of the input data. Variables (columns) start on the right and wind counter clockwise around the circle. The size of the (scaled) column is shown by the distance from the centre to the point on the star or the radius of the segment representing the variable. The columns of the data matrix are scaled independently so that the maximum value in each column is 1 and the minimum is 0. Segment numbers corresponding to descriptors are defined in Table 1.

