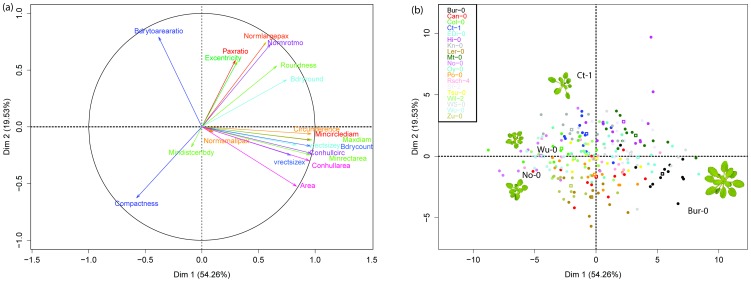
Figure 6. Principal Component Analysis.
(A) Variable loadings for first and second principal components, 17 DAS and (B) Analysis by ecotype over first and second principal components, 17 DAS. Significance level is given by the size of the squares, the smaller the square the more significantly different (P<0.05). (C) Contrast in ‘Area’ between ‘Bur-0’ and ‘Wu-0’ and Contrast in ‘Compactness’ between ‘Ct-1’ and ‘No-0’) and where both ecotypes have similar Area as demonstrated in plot (A).

