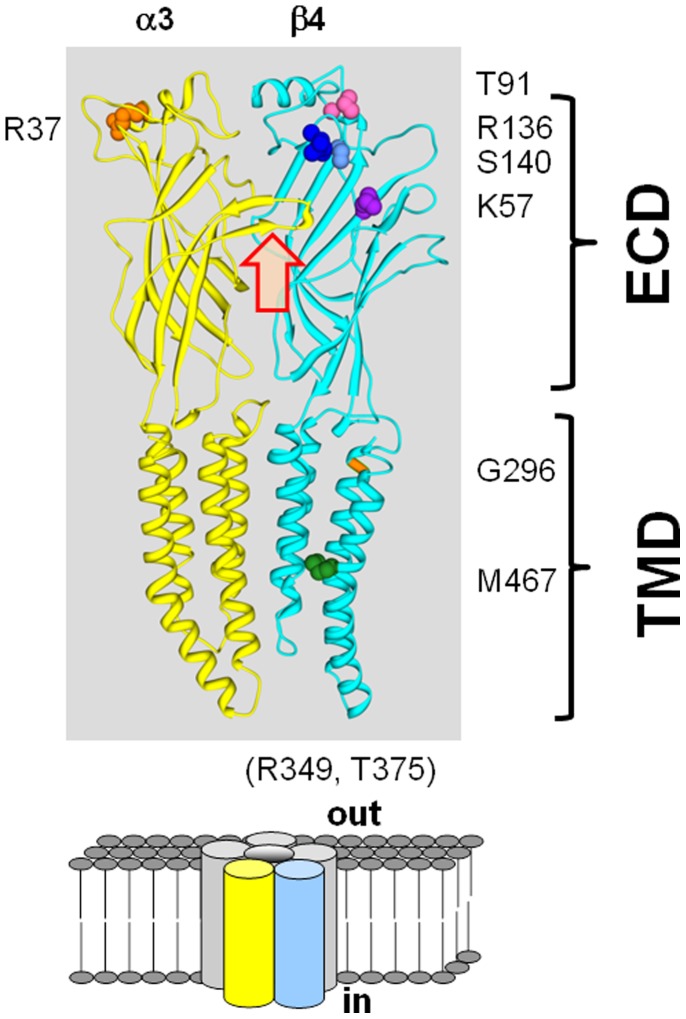
Figure 1. Locations of variants in a homology model of the α3β4 receptor.
The figure shows a homology model of the α3 and β4 subunits, generated using the GluCl crystal structure (see Methods). The view is from the outside of the pentamer (see lower panel for cartoon), and to simplify the image the 3 subunits on the far side of the channel have been omitted. The backbones are shown in ribbon form (α3 yellow, β4 cyan). Locations of variants are shown as spheres colored as follows: in β4(T91) pink, K57 purple, R136 dark blue, S140 light blue, G296 orange, M467 dark green. A variant described in the α3 subunit (α3(R37)) is shown in orange on the α3 subunit. The location of the ACh-binding site is indicated by the red block arrow (the site is formed at the α3–β4 interface). The brackets at the right indicate the extracellular domain (ECD) and the transmembrane domain (TMD). Note that the large intracellular loop is not present in the crystal structure and so the β4(R349) and T375 residues are not shown.

