
Figure 2. mTORC1 signaling, but not pFMRP S499 or tFMRP, is increased in Tsc1 +/− mice.
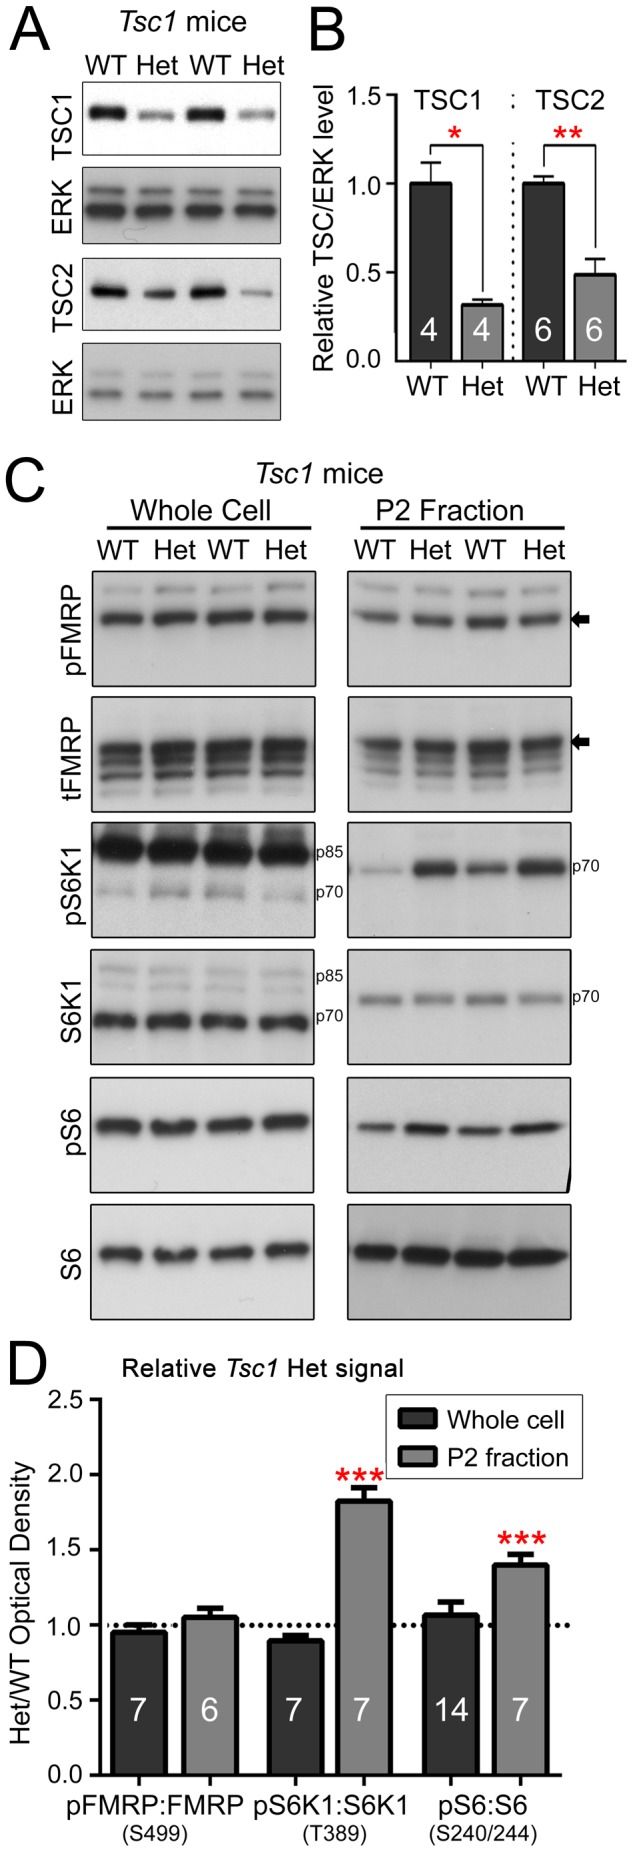
(A) Whole cell cortical lysates from 2 month-old male Tsc1+/+ (WT) and Tsc1+/− (Het) mice were immunoblotted for TSC1 and TSC2. (B) TSC1:ERK and TSC2:ERK are significantly decreased in Het samples. The numbers in the bars indicate the number of mice per condition. (C) Whole cell and P2 fraction lysates from 2 month-old male Tsc1+/+ and Tsc1+/− mice were analyzed by immunoblot. The arrows to the right of the blots indicate the pFMRP isoform. S6K1 isoforms are indicated by p70 and p85. (D) Quantification of western blot performed in whole cell lysate (dark grey) and P2 fraction (light grey) shown in (C). All bars represent Het phospho:total protein values normalized to WT control values. As such, WT values = 1 (as indicated by the dotted line). Error bars are SEM. Red asterisks indicate statistical significance (*P<0.05; ** P<0.01, and ***P<0.001) by one-sided (in B) and two-sided (in D) Mann-Whitney Tests, N are listed on the bar graphs.