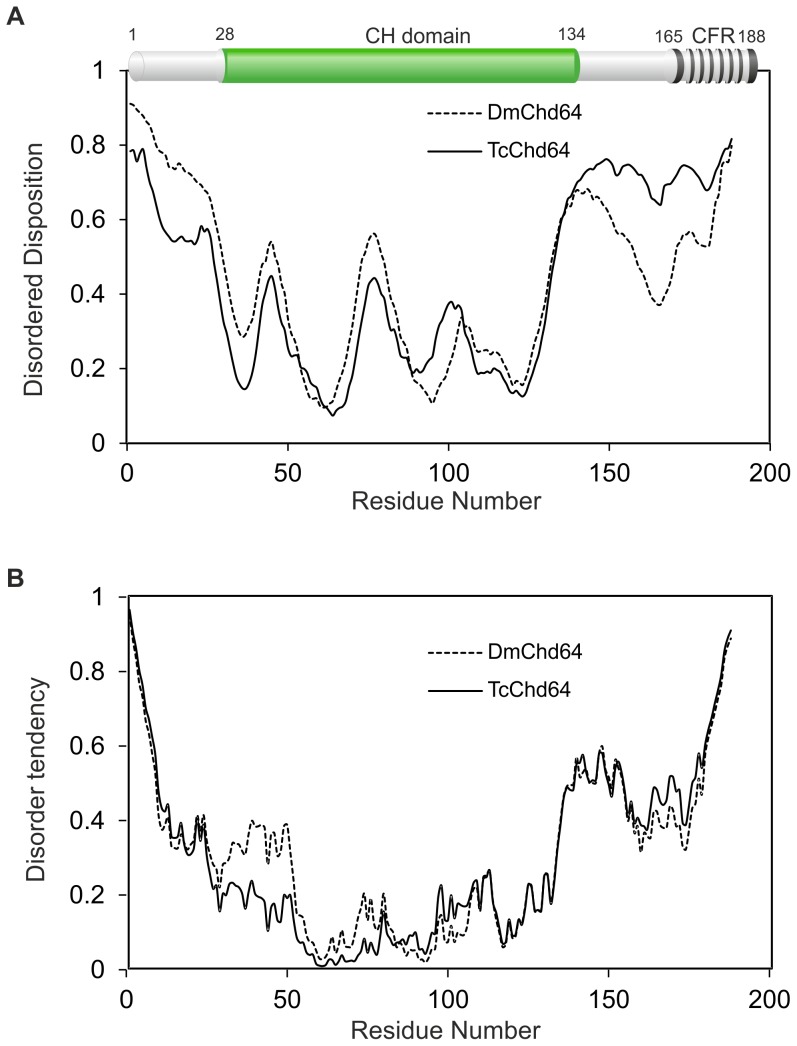
Figure 1. Computational analysis of DmChd64 and TcChd64 sequences.
(A) and (B) The prediction of disordered regions from amino acid sequences. The prediction of the degree of disorder in DmChd64 (dashed line) and TcChd64 (solid line) was calculated from their primary structure using PONDR VSL2[37]–[39] (panel A) and IUPred [42], [43] (panel B) neural network predictors. For the PONDR and IUPred predictors, a score of more than 0.5 indicates a high probability of disorder. The top of the panel A represents a domain structure of Chd64 generated by Pfam [45]. Green colour represents calponin homology (CH) domain and black stripy region corresponds to calponin family repeat (CFR).

