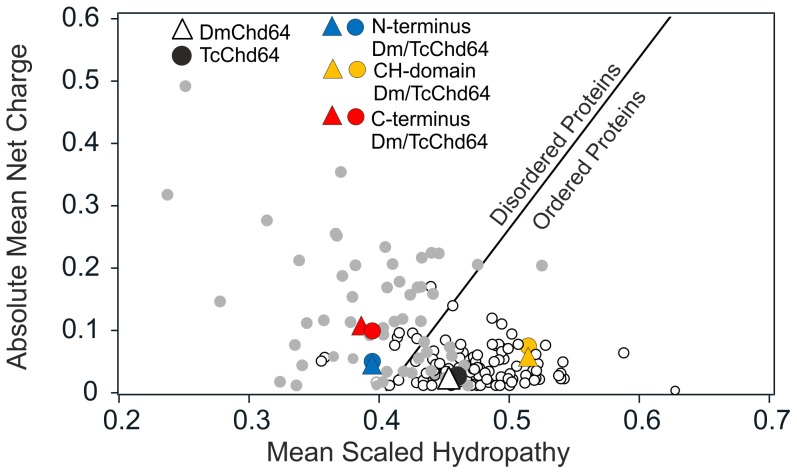
Figure 2. The Uversky plot of DmChd64 and TcChd64.
The Uversky plot[37]–[39] divides proteins into globular (white dots) and IDP (grey dots) subsets based on their mean net charge versus mean hydropathy. The solid line represents permeable boundary between both subsets. DmChd64 is represented by triangles and TcChd64 by circles. The full-length DmChd64 protein is marked by a white triangle and TcChd64 by a black circle. For fragmented proteins, the following colors were used: blue for N-termini (1–30), yellow for CH domains (30–130) and red for C-termini (130–188).

