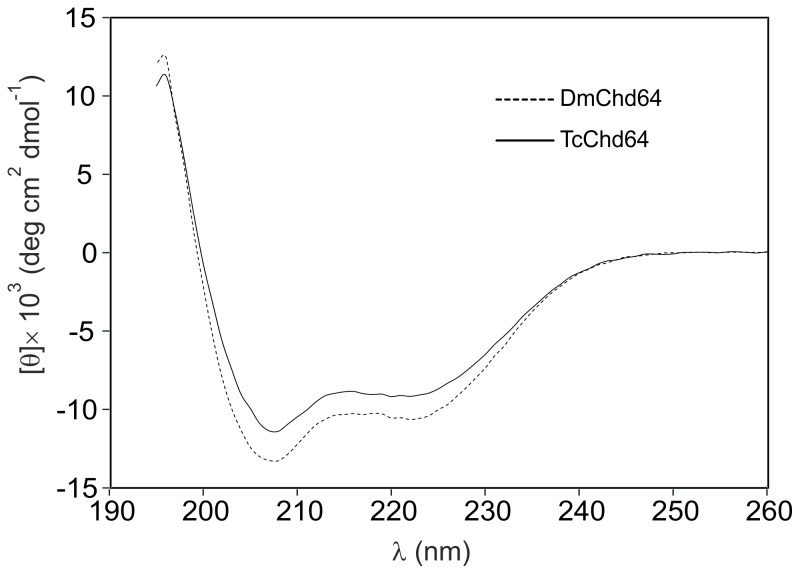
Figure 4. CD spectra of Chd64 from D. melanogaster and T. castaneum.
CD spectra of DmChd64 (dashed line) and TcChd64 (solid line). The far-UV spectra were recorded in 50 mM Na2HPO4, 150 mM NaCl, pH 7 at room temperature. For every measurement, 10 µM of protein (223 µg/ml for DmChd64 and 222 µg/ml for TcChd64) was used. Both spectra of the native proteins display deep minima around 222 nm and 208 nm, which is characteristic of an ordered conformation.

