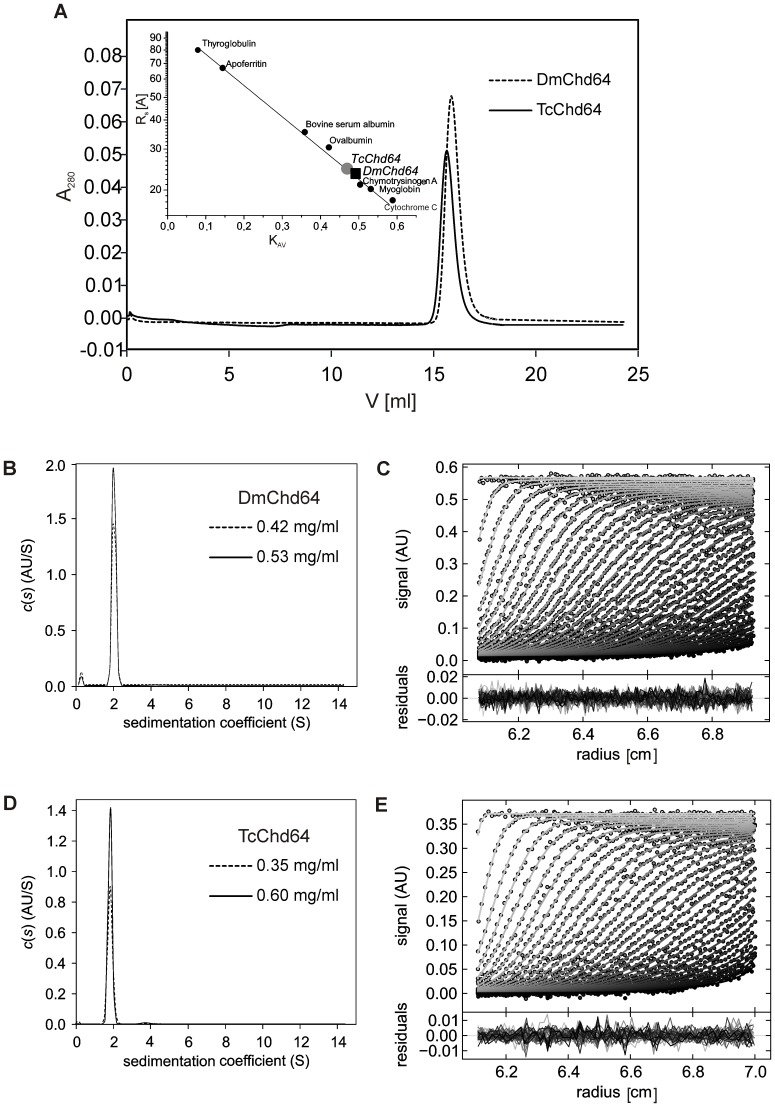
Figure 5. Hydrodynamic properties of DmChd64 and TcChd64.
(A) Analytical size-exclusion chromatography of DmChd64 (dashed line) and TcChd64 (solid lane). Experiments were performed on a Superdex 200 10/300 GL column equilibrated with 50 mM Na2HPO4, 150 mM NaCl, pH 7 at room temperature and at a flow rate of 0.5 ml/min; an injection volume of 0.1 ml was used and the protein concentration was 1 mg/ml. The inset shows the calibration curve determined using standard proteins (black dots). The black square corresponds to DmChd64 and the grey dot to TcChd64. (B), (D) Sedimentation velocity analytical ultracentrifugation analysis. Superposition of the distribution of sedimentation coefficients, c(s) derived via SEDFIT from SV data for DmChd64 in two different concentrations (B) and for TcChd64 in two different concentrations (D) measured using absorbance optics at 280 nm during an SV experiment at 30 000 rpm at 20°C, standardised to water at 20°C. (C), (E) Example of the sedimentation profile of DmChd64 at 0.53 mg/ml (C) and TcChd64 at 0.6 mg/ml (E). Superposition of selected experimental (circles) and fitted (solid lines) SV profiles corrected for all systematic noises, with an rmsd of 0.004531 for DmChd64 and 0.003496 for TcChd64 indicating a good fit of the SV data. The inset shows the superposition of the residuals between the experimental and fitted curves.

