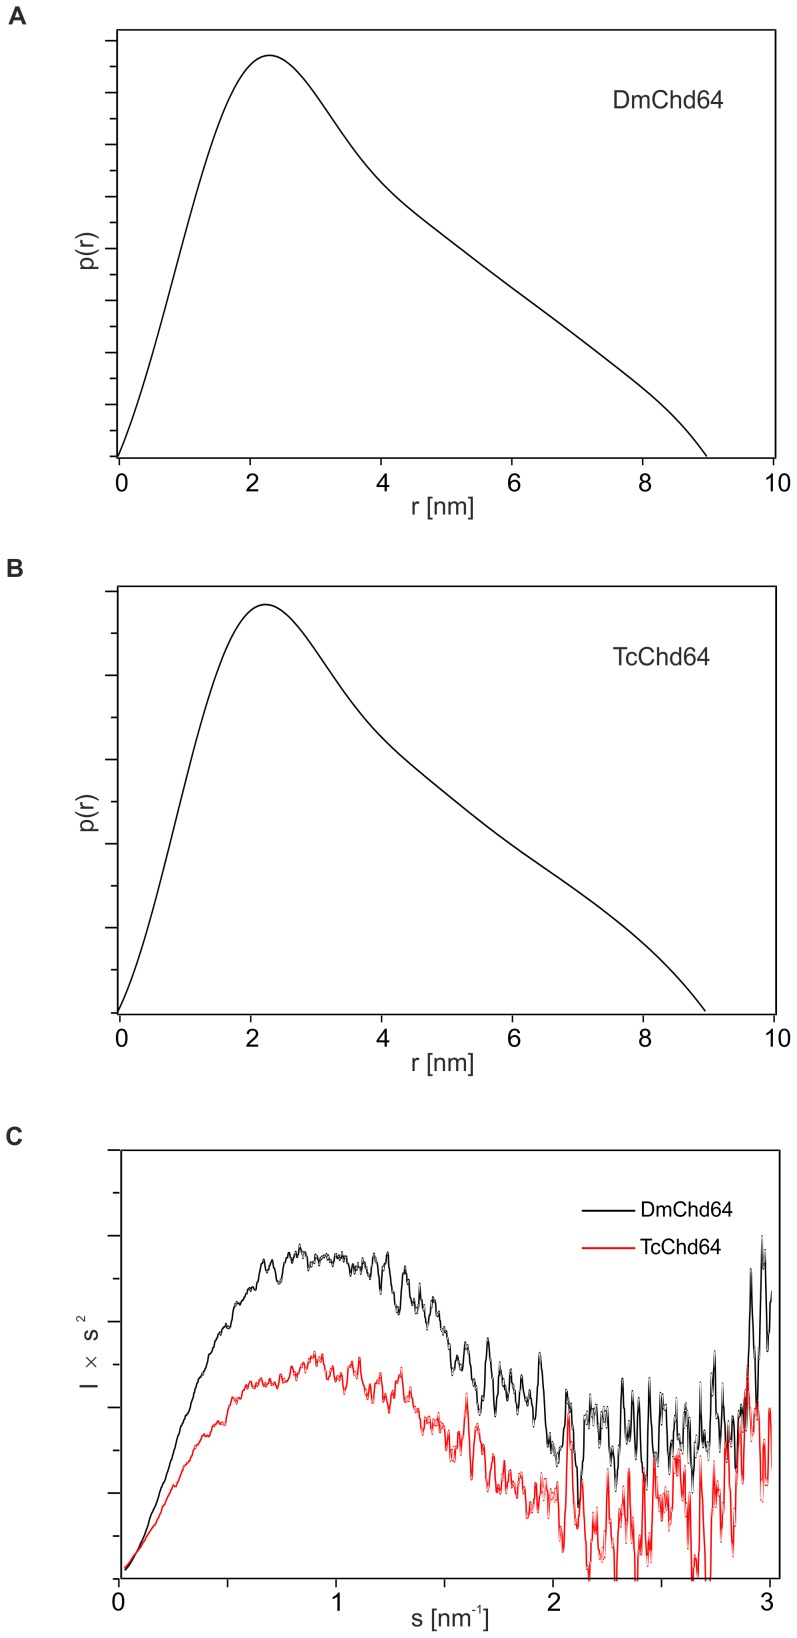
Figure 6. Small Angle X-ray Scattering characteristics for DmChd64 and TcChd64.
(A), (B) Pair distribution function p(r) of DmChd64 (A) and TcChd64 (B). For both analysed proteins p(r) functions are asymmetric, which indicates the proteins have an elongated shape. (C) Kratky plot analysis of DmChd64 (black line) and TcChd64 (red line), where the intensity of scattering is plotted as Is2 versus s. For both proteins, the plots exhibit one maximum. At higher s values the curves reach a plateau, which suggests the existence of disorder.

