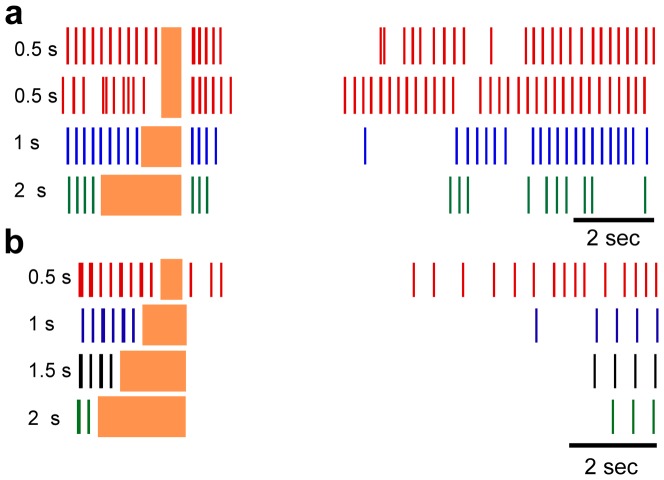
Figure 6. Individual neuron responses to changes in stimulus duration.
Rasters of an individual human thalamic neuron (a) and an individual model neuron (b) to various durations of stimulation at 200 Hz. The stimulus amplitude was 2 µA for the human response and 1.5 V for model response. Replicate trials of 0.5 s stimulation are shown to illustrate the trial-to-trial variability in the responses of the human neurons. The duration frequency for each raster is indicated for each raster. The vertical shaded region indicates the time when stimulation was on, and the duration for each stimulation period is indicated to the left of each raster.

