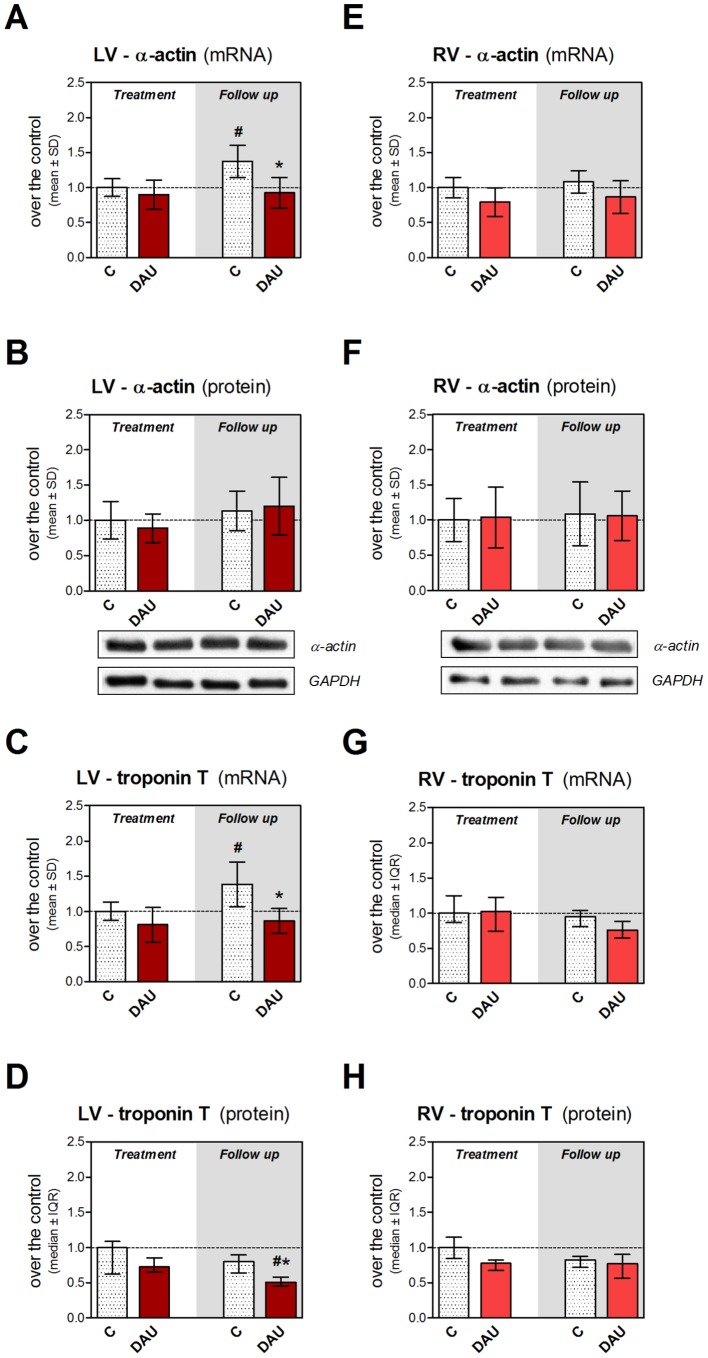
Figure 5. Expression of thin filament proteins in chronic anthracycline cardiotoxicity and post-treatment follow up.
Gene expression of cardiac α-actin (A, E) and cardiac troponin T (C, G) in the left and right ventricular myocardium, respectively. Western blot analysis of protein levels of cardiac α-actin in the left (B) and right (F) ventricle. ELISA determined abundance of the cardiac troponin T in the left (D) and right (H) ventricular myocardium. Statistical significances (One Way ANOVA/One Way ANOVA on Ranks according to data character, P<0.05) within each study period (*) or between the treatment and post-treatment period (#). C - control group, DAU - daunorubicin group.

