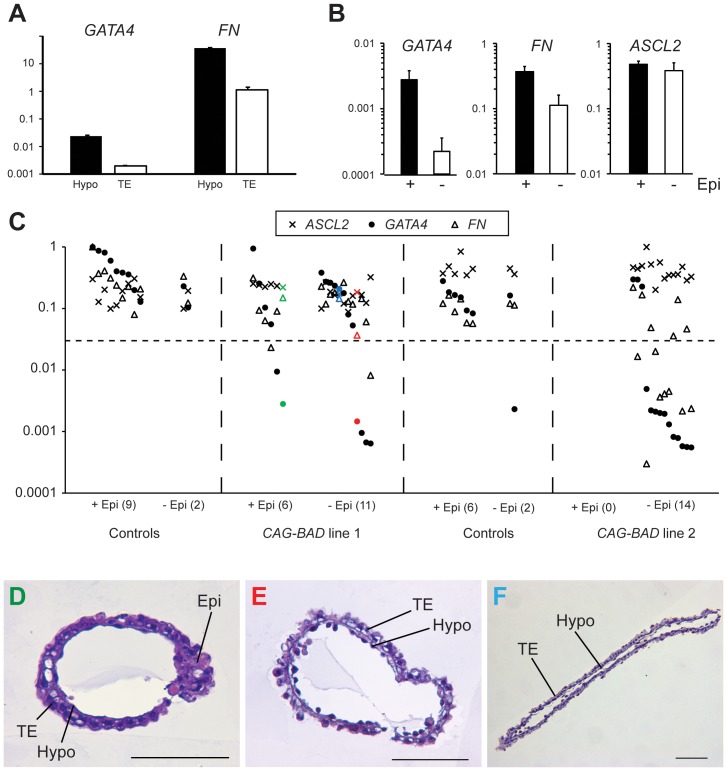
Figure 7. Molecular characterization of BAD-tg embryos for hypoblast and trophectoderm markers.
A. Real-time RT-PCR measurement of GATA4 and FIBRONECTIN expression, normalized to the housekeeper GAPDH, for isolated Day 14 trophectoderm (TE) and hypoblast (Hypo) tissue. B. Mean GATA4, FIBRONECTIN and ASCL2 mRNA levels (normalized to three housekeepers) in epiblast containing (black bar) and epiblast-less embryos. For GATA4 and FIBRONECTIN, P<0.01 (t-test); error bars represent s.e.m. C. GATA4, FIBRONECTIN and ASCL2 mRNA levels (log expression for each gene relative to maximum expression value) in trophoblast/hypoblast fragments of CAG-BAD-overexpressing and control embryos, clustered into epiblast-containing and epiblast–less groups, with number of embryos per group shown in brackets. Coloured markers represent the three sectioned embryos depicted in panels D-F (coloured correspondingly). D. Cross section of CAG-BAD line 1 embryo containing an epiblast but severely reduced/no GATA4 expression. E. Cross section of CAG-BAD line 1 embryo without an epiblast, severely reduced GATA4 and lower than average FIBRONECTIN expression. F. Embryo as per panel E but showing no altered hypoblast marker expression. Bars are 0.1 mm.

