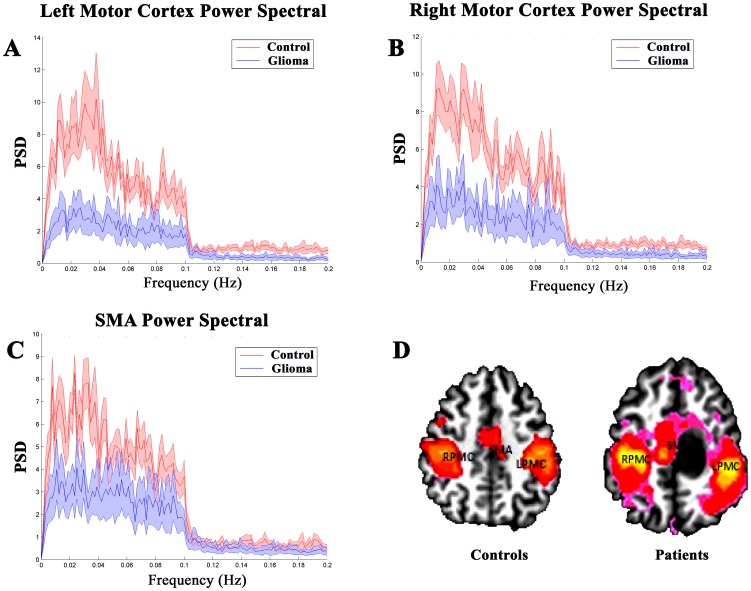
Figure 3. The power spectral density (PSD).
A, B, and C show the group mean PSD in the LPMC, RPMC and SMA between healthy subjects (red traces) and patients with brain gliomas (blue traces). D, The localization of three key motor regions. In patients with brain gliomas, the PSDs in the LPMC, RPMC, and SMA are significantly lower than the PSDs of healthy controls (P<0.05). LPMC, left primary motor cortex; RPMC, right motor cortex; SMA, supplementary motor area.

