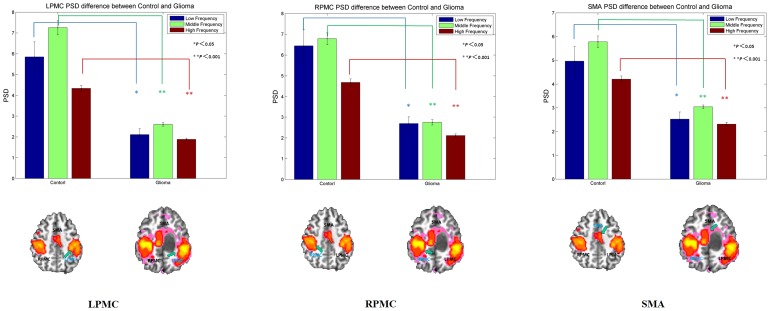
Figure 4. Bar graphs show the PSD in the three non-overlapping frequency bands for the three key regions of the motor network in healthy subjects and patients with brain gliomas.
The sub-divisions of the low-frequency band were: low, 0.01–0.02 Hz; middle, 0.02–0.06 Hz; and high, 0.06–0.1 Hz. Patients with brain tumors show significant PSD decreases in all bands in all three key motor cortical regions (LPMC, RPMC, and SMA) (*P<0.05; ** P<0.001). PSD, power spectral density; LPMC, left primary motor cortex; RPMC, right motor cortex; SMA, supplementary motor area.

