
Figure 1.
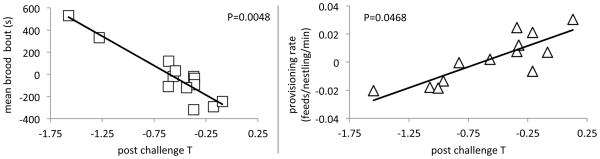
Scatter plots relating parental behavior (left: brooding behavior; right: provisioning behavior) to ability to produce T in response to GnRH challenge. Points in the scatter plots for T are leverage pairs, akin to partial correlation (see statistical methods), P values are from single effects in multiple regression.