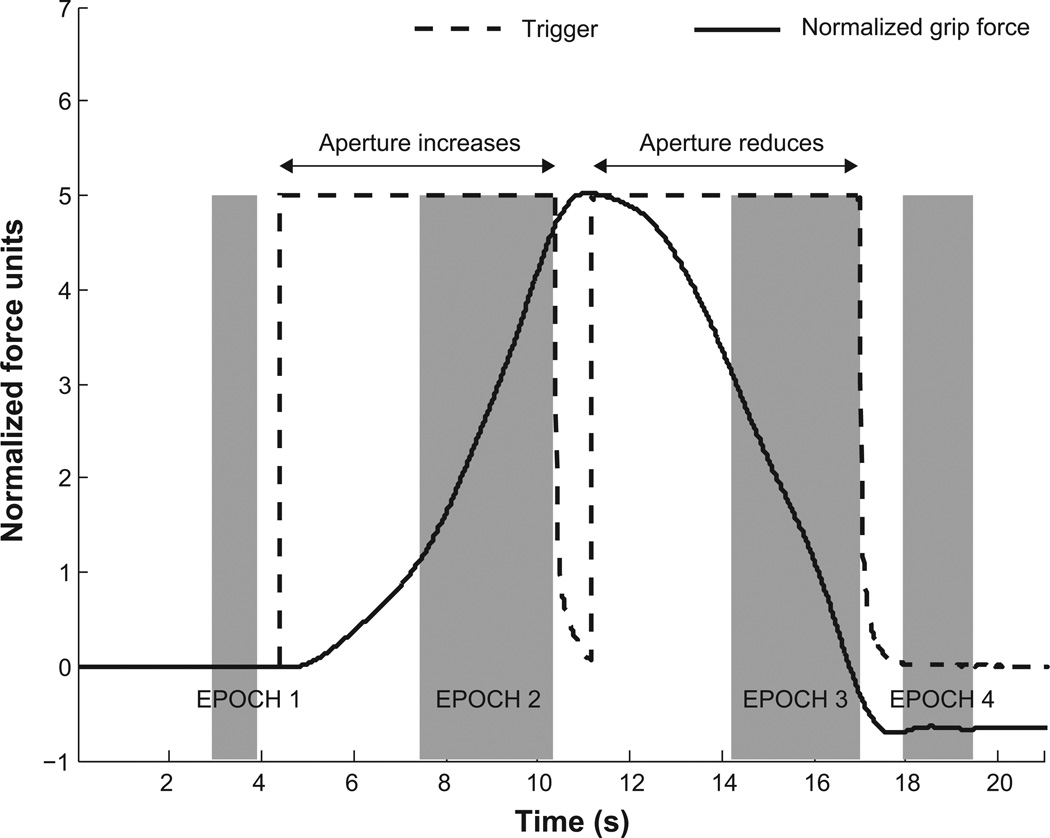
Figure 2.
Typical subject response. The normalized grip force (thick black trace) and the trigger signal (dashed black trace) are plotted against time. The initial value of the normalized force at time 0 s is arbitrarily set to zero. Grip force increases as the aperture increases and decreases as the aperture reduces. The data is partitioned into four epochs associated with the initial steady state, aperture opening, aperture closing, and the final steady state. These are indicated as shaded bands.

