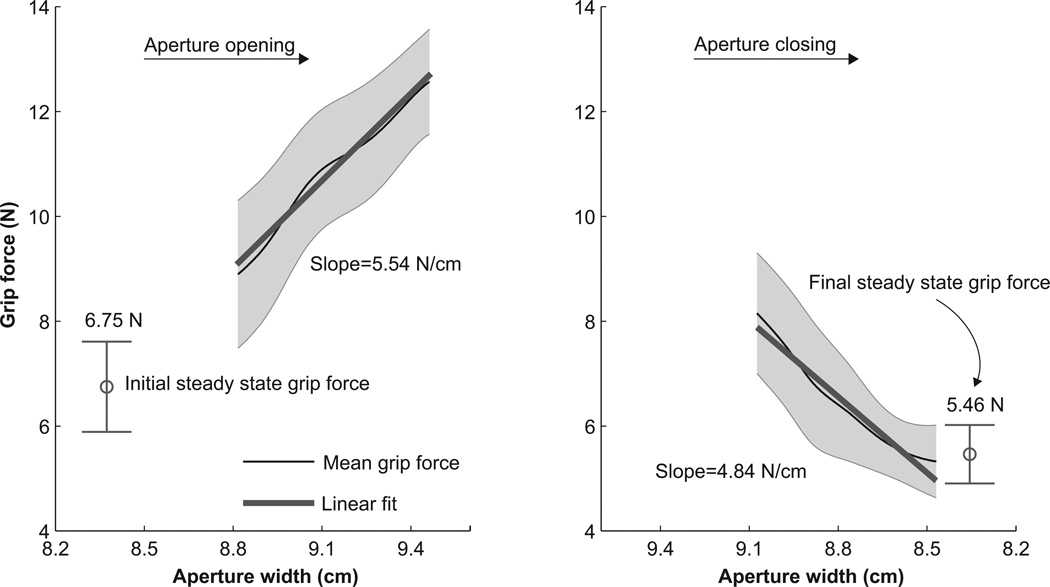
Figure 3.
Computation of grip force and apparent stiffness (AS) for a representative subject. Data averages are across three repetitions for a particular wrist position, eye condition, and initial aperture size. Left panel shows the initial steady-state grip force (mean and SD) and the mean (black line) and SD (black band) of the grip force as the aperture increases from left to right. The right panel shows the mean (black line) and SD (black band) of the grip force as the aperture decreases from left to right and the final steady state grip force (mean and SD). The thick black line in each panel are the linear regression lines to the mean grip forces. The slopes of these linear fits are the AS.

