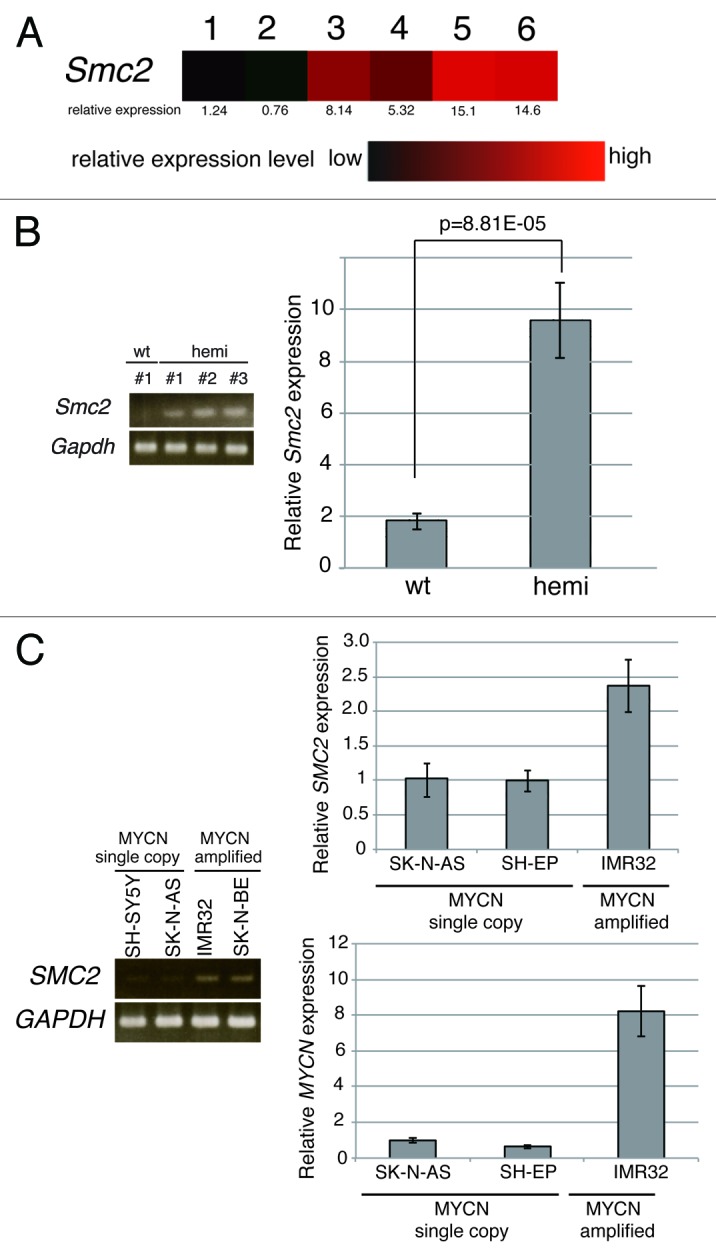
Figure 1.Smc2 expression in neuroblastoma model mice and SMC2 expression in human neuroblastoma cell lines. (A) Results of a microarray analysis of the relative expression levels of Smc2 in ganglia of wt mice (lanes 1 and 2), and precancerous (lanes 3 and 4) and tumor lesions (lanes 5 and 6) of homozygous MYCN Tg mice. (B) Semi-quantitative (left) and quantitative (right) RT-PCR analyses of Smc2 and Gapdh (control) expression levels in 3 precancerous lesion samples from hemizygous MYCN Tg mice (hemi) and ganglia of wt mouse. (C) Semi-quantitative (left) and quantitative (right) RT-PCR analyses of human SMC2 expression levels in various human neuroblastoma cell lines. SH-SY5Y, SK-N-AS, and SH-EP cells have a single copy of MYCN, and IMR32 and SK-N-BE(2) have amplified MYCN. The expression levels of Smc2 and SMC2 detected by RT-qPCR were normalized to those of Gapdh and GAPDH respectively.
