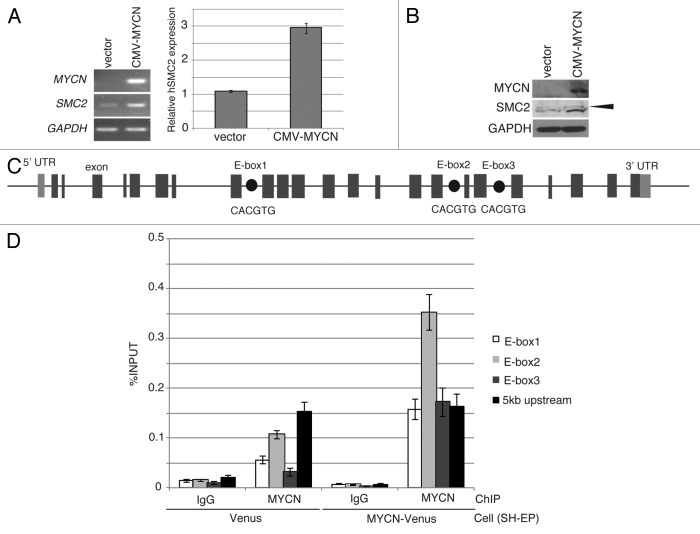
Figure 2. Overexpression of MYCN induces SMC2 expression in human neuroblastoma cells. (A and B) A CMV-driven plasmid containing MYCN was introduced into the SH-EP MYCN single copy cell line. After live cell sorting, the levels of human SMC2 mRNA and protein were measured by semi-quantitative (A, left) and quantitative (A, right) RT-PCR, as well as by immunoblotting (B). The arrowhead in (B) indicates a non-specific band. The expression levels of SMC2 detected by RT-qPCR were normalized to those of GAPDH. (C) Schematic representation of the E-boxes identified in the human SMC2 gene. The light gray boxes indicate the 5′ and 3′ UTRs; the dark gray boxes indicate the exons; and the black circles represent putative E-boxes (MYCN-binding sites). The sequences of the E-boxes are shown. (D) ChIP followed by qPCR analysis of the E-boxes in the SMC2 gene was performed using control IgG or an anti-MYCN antibody in SH-EP cells expressing Venus (control) or MYCN. The 5-kb sequence upstream of the SMC2 gene was examined as a negative control. The data show the percentage of the target DNA precipitated with the control IgG or MYCN antibody and are represented as the mean ± SE of at least n = 3 independent experiments.

An official website of the United States government
Here's how you know
Official websites use .gov
A
.gov website belongs to an official
government organization in the United States.
Secure .gov websites use HTTPS
A lock (
) or https:// means you've safely
connected to the .gov website. Share sensitive
information only on official, secure websites.
