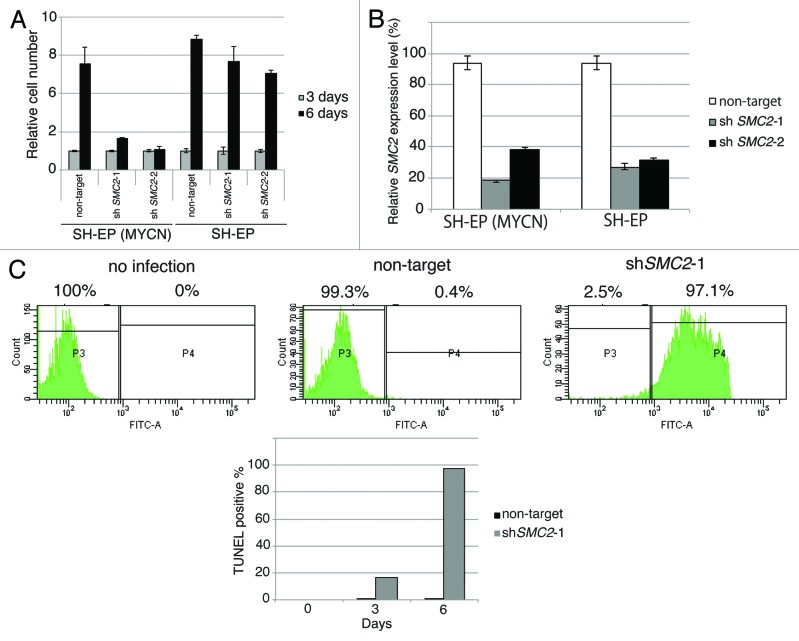
Figure 3A–C. Knockdown of SMC2 induces DNA damage and apoptosis. (A) Growth of MYCN-overexpressed SH-EP cells and control SH-EP cells infected with non-target shRNA or SMC2-specific shRNAs. Counting started 3 d after infection. On each day, 3 plates were counted and averaged. Data are shown as a ratio of the number of cells at 3 d after transfection and are represented as the mean ± SD of n = 3 independent repeats. (B) SMC2 knockdown efficiency of (A). (C) TUNEL staining of apoptotic IMR32 cells at 6 d after infection (upper panel) and quantification of apoptotic IMR32 cells at the indicated time-points (lower panel). On each day, 3 plates were counted and averaged. (D) Immunofluorescence of γ-H2AX and DAPI staining of IMR32 (MYCN-amplified), SK-N-BE(2) (MYCN-amplified), SK-N-AS (MYCN-single copy), and SH-EP (MYCN-single copy) cells infected with non-target or SMC2-specific shRNA. Images were captured 3 d after infection. (E) Quantification of the γ-H2AX-positive cells shown in (D). Data are represented as the mean ± SD of n = 3 independent repeats. Their homoscedasticities were checked by f test. Statistical significance was evaluated with a 2-tailed, unpaired t test. (F) The percentage viability of SH-EP or MYCN overexpressed SH-EP cells infected with non-target or SMC2-specific shRNA and treated with cisplatin (left) or campthotecin (right). Data are represented as the mean ± SE of n = 3 independent experiments. Their homoscedasticities were checked by f test. Statistical significance was evaluated with a 2-tailed, unpaired t test.

An official website of the United States government
Here's how you know
Official websites use .gov
A
.gov website belongs to an official
government organization in the United States.
Secure .gov websites use HTTPS
A lock (
) or https:// means you've safely
connected to the .gov website. Share sensitive
information only on official, secure websites.
