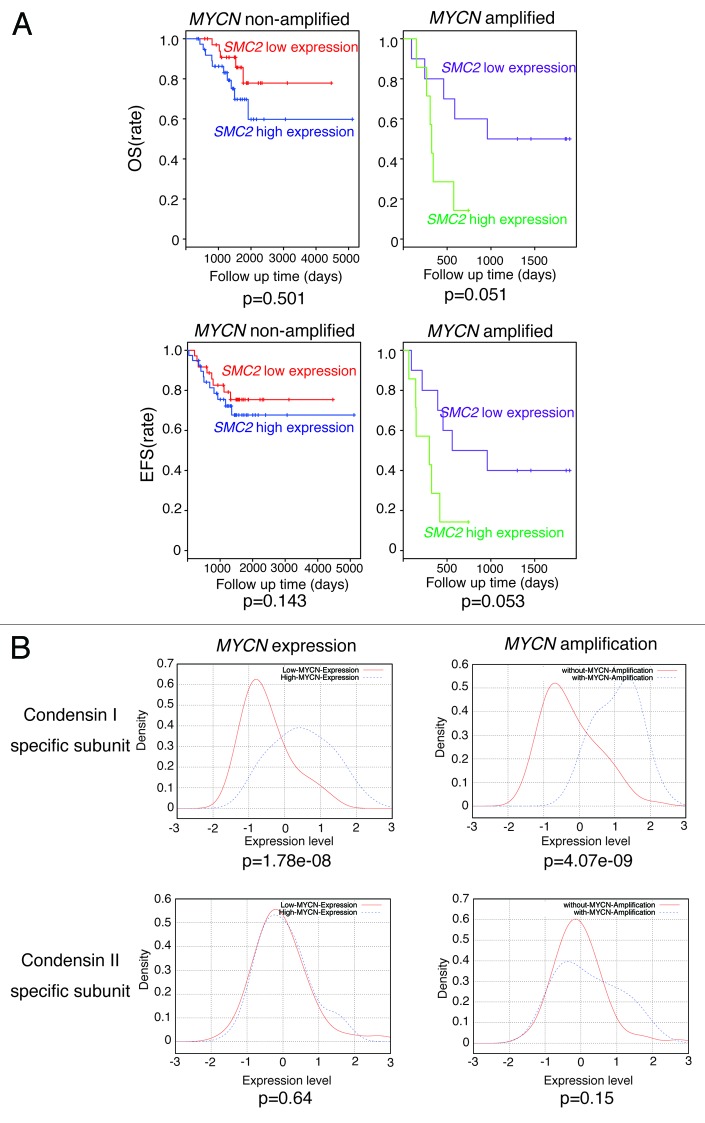
Figure 5. Clinical data showing the relationship between SMC2 expression and patient prognosis in the Wang cohort.48 (A) The effects of SMC2 expression on the overall survival (OS) and event-free survival (EFS) rates of patients bearing MYCN-amplified and non-amplified tumors. Within each of the 2 tumor subsets considered, those with expression levels of SMC2 greater than the median (blue or green line) were compared with the remainder of the tumors in the subset (red or purple line) using a Kaplan–Meier analysis. (B) Expression levels of condensin I- and condensin II-specific subunits and their relationship to MYCN amplification or expression. The data were obtained from a published data set (GSE3960). The red line indicates low MYCN expression or no MYCN amplification, and the blue line indicates high MYCN expression or MYCN amplification.

An official website of the United States government
Here's how you know
Official websites use .gov
A
.gov website belongs to an official
government organization in the United States.
Secure .gov websites use HTTPS
A lock (
) or https:// means you've safely
connected to the .gov website. Share sensitive
information only on official, secure websites.
