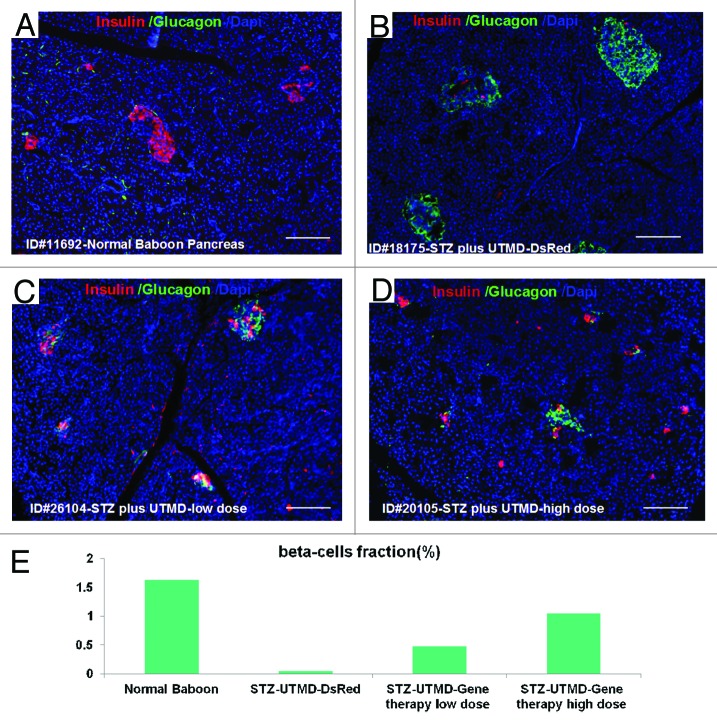
Figure 1. Confocal microscopic images of insulin (red), glucagon (green), and Dapi (blue). (A) Baboon ID#11692, normal baboon pancreas; (B) Baboon ID#18175, STZ plus UTMD pBIP3.1-DsRed reporter gene; (C) Baboon ID#26104, STZ plus UTMD-pBIP3.1-cyclinD2/CDK4/GLP-1 genes (12 mg of plasmid); (D) Baboon ID#20105, STZ plus UTMD-pBIP3.1-cyclinD2/CDK4/GLP-1 genes (20 mg of plasmid); scale bar is 120 µm. (E) The lower panel displays the percentage of β-cell area in total pancreatic area (%).

An official website of the United States government
Here's how you know
Official websites use .gov
A
.gov website belongs to an official
government organization in the United States.
Secure .gov websites use HTTPS
A lock (
) or https:// means you've safely
connected to the .gov website. Share sensitive
information only on official, secure websites.
